Plant Hardiness Zone Maps and the Arnold Arboretum
Picking the right plant for the right spot requires getting into the “zone.” Professional horticulturists, nursery operators, and home gardeners alike rely on plant hardiness zone maps to help them choose plants with the best chance of survival in their regions. Over the past century, the Arnold Arboretum and the United States Department of Agriculture (USDA) in particular have produced maps charting estimations of plant hardiness which have been periodically revised to reflect on-going changes in environments due to global warming and climate change.
The story of hardiness zones begins at the Arnold Arboretum. In 1927, Arboretum taxonomist Alfred Rehder published the Manual of Cultivated Trees and Shrubs Hardy in North America. The book included a small but groundbreaking map of America that Rehder had divided into temperature zones. The map keyed to descriptions showing the minimum and maximum geographical ranges in which the plants would likely be hardy. The map reflected research and scholarly thought on climate and plant hardiness that was percolating in the late nineteenth and early twentieth centuries. Rehder may have read climatologist Wladimir Köppen’s 1884 article ”The Thermal Zones of Earth” outlining a classification system for the world’s climate, as well as the papers from the International Conference on Plant Hardiness and Acclimatization held in New York City in 1907.

Rehder’s map divided the continental U.S. into eight temperature zones, arranged north of a line curving through states in the deep South—an area Rehder describes as “the subtropical and warm-temperate regions” that included most of Texas and all of Florida. The zones differed by five degrees Fahrenheit in charting the “lowest mean temperature of the coldest month.” They run in gentle curves across the country until they reach Colorado, where Zone 5 arches upwards and then curves downward again in the Rocky Mountains. From there the zones all curve northward as they approach the West Coast, reflecting the mild temperatures of the Pacific Northwest.

Although it signaled an important start, Rehder’s map was not ideal. It did not encompass the warmest parts of the country because his Manual did not include that region’s flora―species largely unsuitable for cultivation in Boston. Another decade would pass before a revised map was published in another Arboretum publication, Hedges, Screens and Windbreaks by horticulturist Donald Wyman in 1938. Wyman’s map incorporated climate data compiled by the USDA from 1895–1935, including temperatures recorded during the particularly severe winters of 1932–33 and 1933–34.
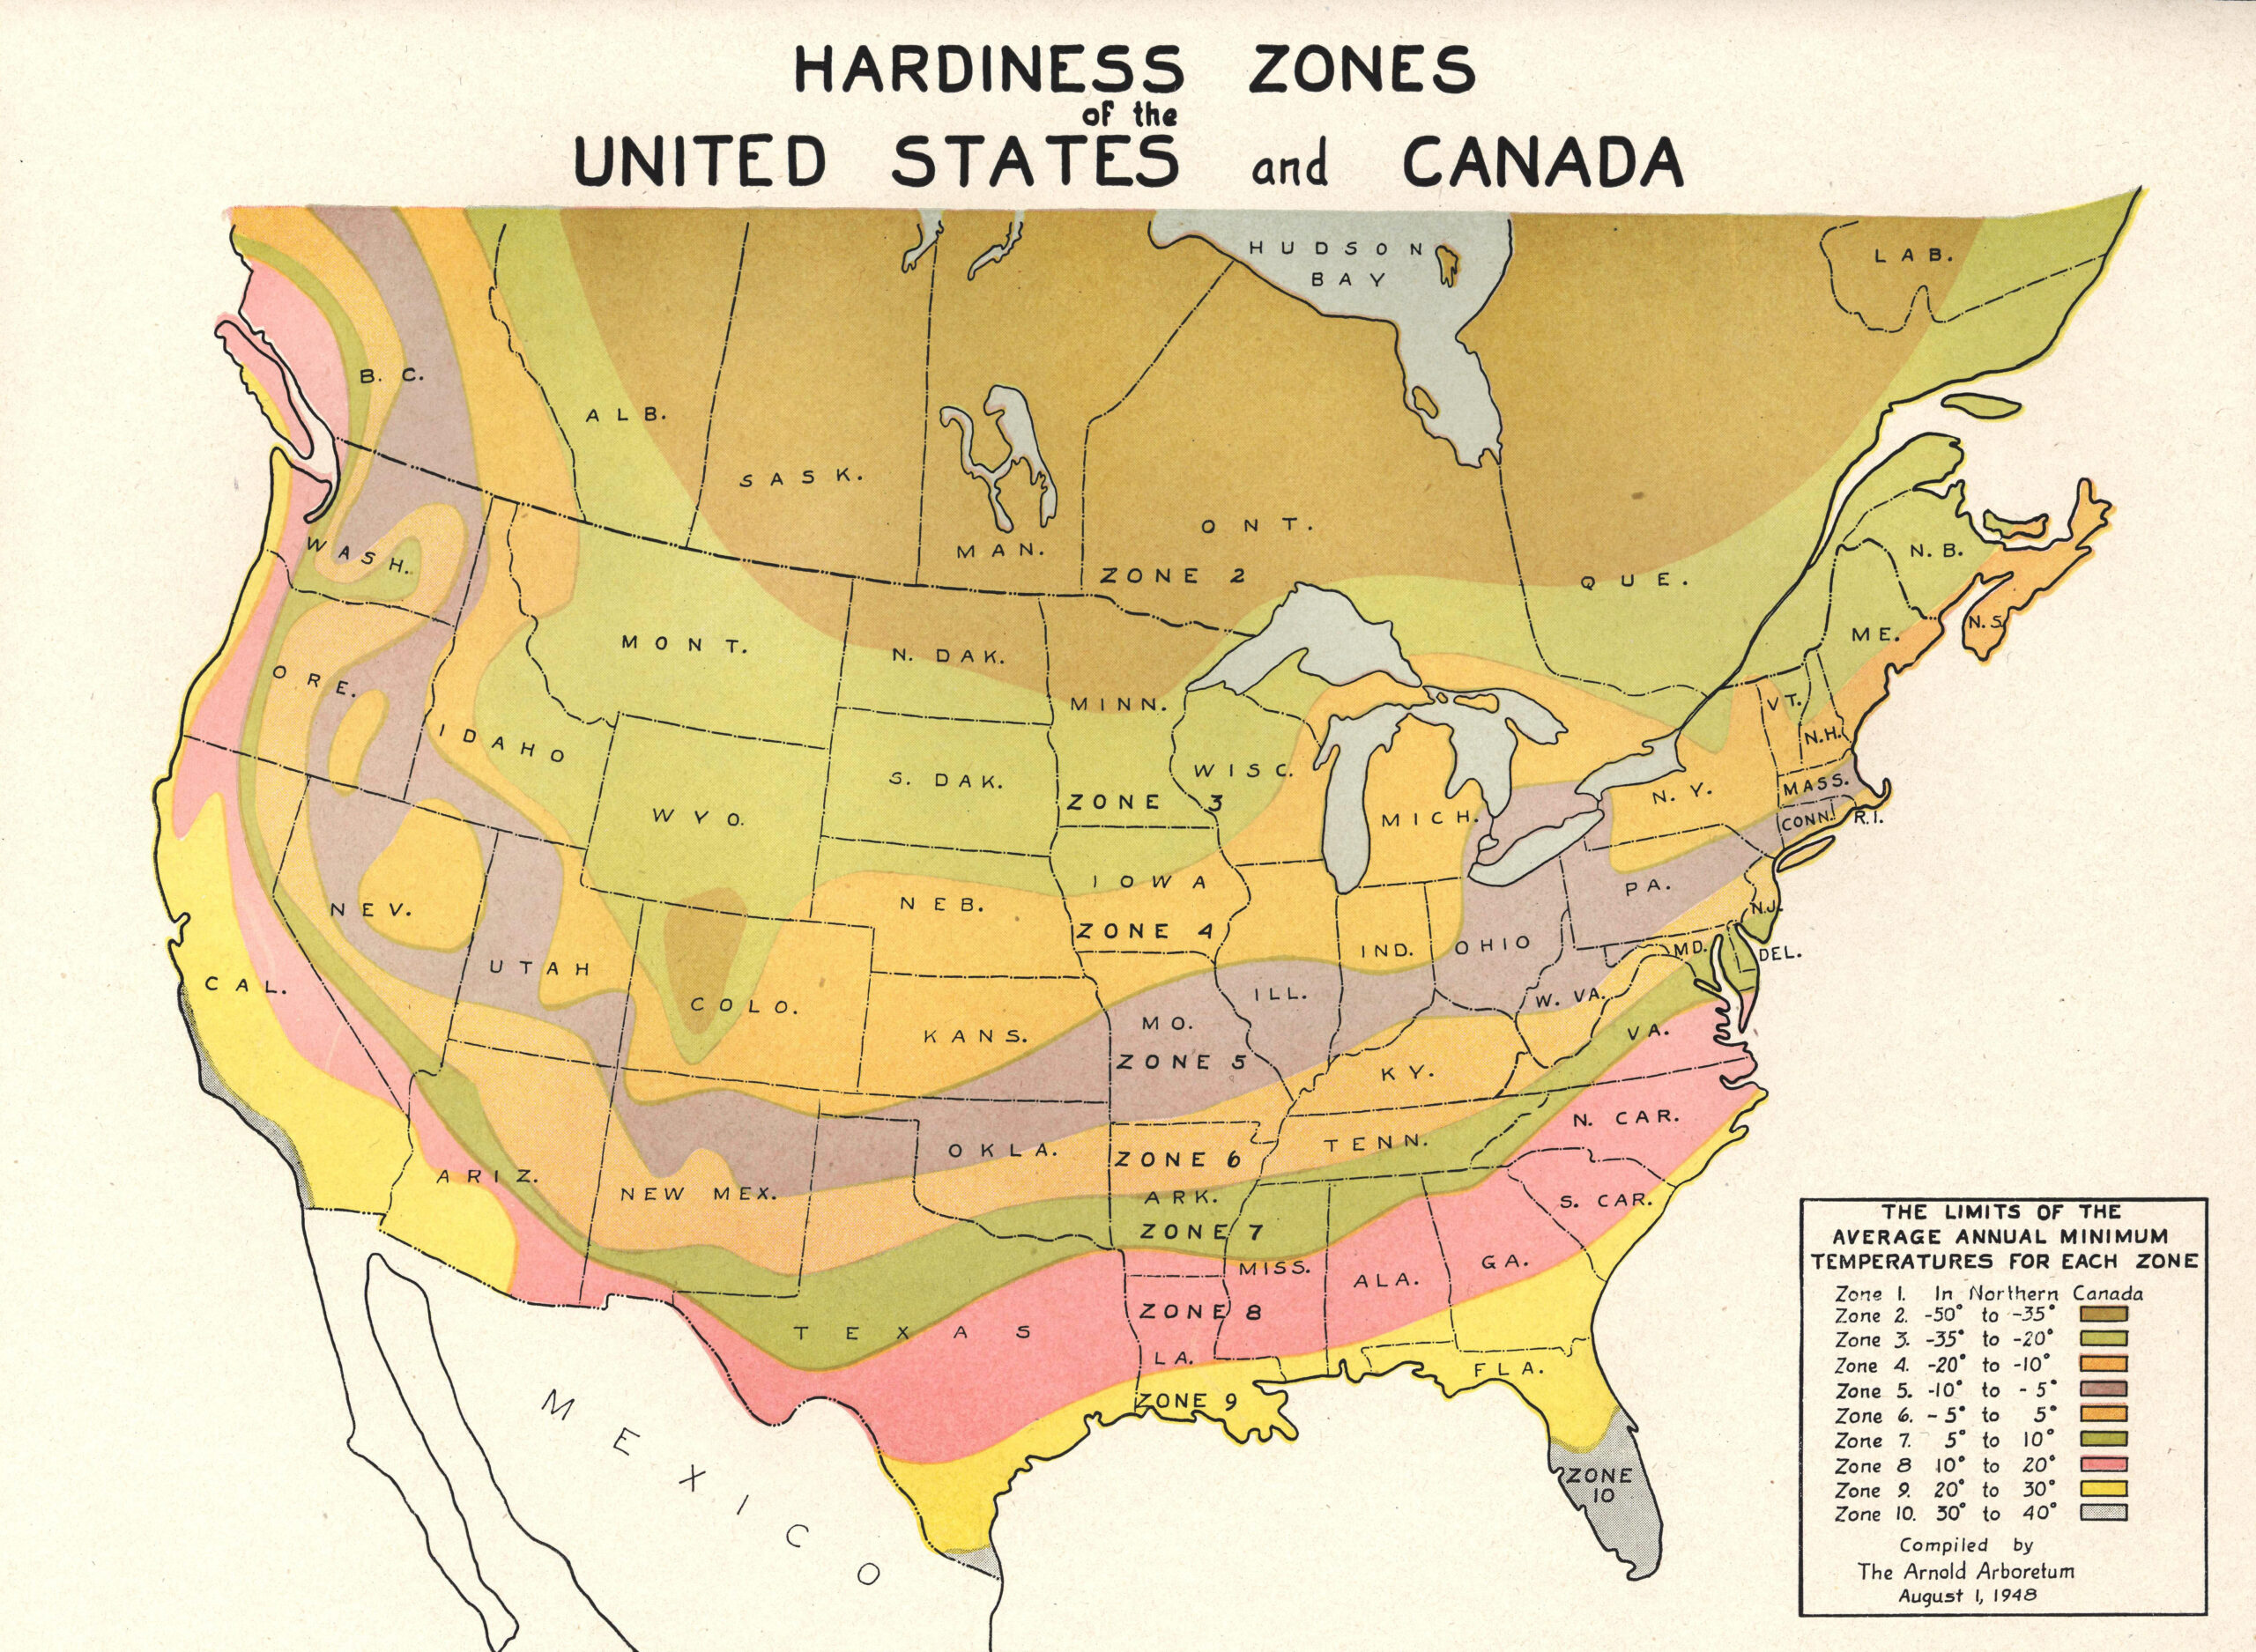
A revised and expanded hardiness zone map appeared in Wyman’s Shrubs and Vines for American Gardens in 1949, featuring hardiness specifications for the entirety of the continental United States and southern Canada. Further revisions followed in 1967 and 1971 as updated temperature information became available. In these maps, the zone numbering—including the Zone 5 (-10 to -5 degrees Fahrenheit) designation for the Arboretum landscape—still corresponded with values derived from Rehder’s Manual.

Nearly 35 years after Rehder and the Arboretum introduced their pioneering map, the USDA produced its own hardiness zone map of the U.S. in 1960. It varied from the Arboretum map in that the zones were differentiated in 10-degree Fahrenheit increments that were further subdivided into 5-degree ”sub-zones.” Unfortunately, differences between the two maps created confusion for users when the USDA map was used to visualize hardiness ratings in Rehder’s Manual and other publications.
A major revision of the USDA map came in 1990, when for the first time it included Alaska, Hawaii, Mexico, and all of Canada for a complete picture of North American plant hardiness. In contrast to the 1960 and 1965 maps, makers of the 1990 version had access to twice as much weather station data, adding considerably to the granularity and accuracy of the results. Temperature readings from the Arnold Arboretum certainly contributed to this effort, as staff have recorded and shared weather data collected at its Dana Greenhouses weather station since 1965. A second weather station at the Arboretum was installed at the Weld Hill Research Building when it opened in 2011.

The USDA’s most recent hardiness zone map debuted in 2012. Reflecting weather data compiled over the 29-year period ending in 2005, the map adds two new tropical zones (12 and 13) for Hawaii and Puerto Rico. Many locations across the U.S. saw their zones edge up by a half degree thanks in part to the increased detail of the new map. Because it was created to optimize online use and reference, it is also fully interactive and searchable.
Ultimately, guidance from any hardiness map should be considered in concert with information about the plant in question and the grower’s local conditions. In a November 1940 article in the Bulletin of Popular information Donald Wyman alludes to this necessity. “Hardiness of plants is an indeterminable quantity,” he wrote, “based not only on a plant’s resistance to minimum temperatures, but also on its resistance to maximum temperatures, and other factors such as lack of water, exposure, soil conditions, length of growing season, etc. It would be impossible to prepare a map depicting all these factors, though several might be included on a complex one. However, since a map based on the average annual minimum temperatures agrees in many instances with the known limits of hardiness of certain plants, these data were adopted as the basis for hardiness zones.”