As a teenager, in the 1970s, I traveled with my siblings across the United States and Canada on a few multi-week road trips, camping and visiting National Parks and Forests. Along the way, I became fascinated by how different trees grow in different places—the tall, narrow-crowned Engelmann spruce (Picea engelmannii) found in the high elevations of the northern Rocky Mountains (which were still snow packed in the middle of June) and the incense cedar (Calocedrus decurrans) showing off its brilliant red bark on the western slope of the Sierras. The local tree species, I realized, were as distinct as the terrain—patterns that emerged over millions of acres and thousands of miles. The quest for adventure and the desire to see the natural world drove my ambitions, facilitated by recently completed interstate highways and a personal automobile. Ecological patterns that were once relatively difficult to see now emerged, much like the transition from still frames to movie frames, via easy roadside stops to get into the wilds.
Around this exact same time, these fundamental biological patterns were being synthesized into a comprehensive set of North American tree distribution maps by a botanist at the United States Forest Service named Elbert Little Jr. These maps were published in a six-volume set, collectively titled the Atlas of United States Trees, which covered around 720 species. Each map included shapes that represented the maximum extent of the distribution for a single species. Little and his collaborators developed these by drawing an outline around locations obtained from numerous published and unpublished sources, as well as personal knowledge. For decades, Little’s maps have served as the definitive source for this distribution information. I referenced them as a student at the State University of New York’s College of Environmental Sciences and Forestry in the early 1980s. And digital reproductions of Little’s maps are now included on the Wikipedia pages for most—if not all—of the tree species that he documented.
In 2007, however, I began working with colleagues at the United States Forest Service to project the potential for forest mortality due to insects and diseases fifteen years into the future. This involved building thousands of models based upon remotely sensed imagery, environmental variables, and observations from field plots. After many trials and iterations, we recognized a need to bound the modeled maps by known tree distributions, but we knew that Little’s maps couldn’t be used for this type of analysis. For instance, if we were attempting to understand the threat of emerald ash borer (Agrilus planipennis) on populations of white ash (Fraxinus americana)—a widespread forest species in eastern North America—Little’s map would suggest that white ash was equally prevalent in New York and Illinois, given that both states fall entirely within the range. Yet New York is widely forested, while Illinois is extensively cultivated. As a result, white ash populations would be much more fragmented in the western portion of its range, and Little’s maps did not reveal this trend. Clearly new information was needed.
Original Maps
The history of mapping North American tree distributions is an ongoing narrative of collaboration on a national scale, but the evolution of these maps also reveals how cultural values (and even politics) factor into seemingly straight-ahead descriptive botany. My team began working on new distribution maps because of environmental concerns about the globalization of insects and diseases, an issue that wasn’t remotely part of the scientific consciousness in 1880, when Charles Sprague Sargent, the founding director of the Arnold Arboretum, was leading an initiative to describe and inventory forested landscapes for the 1880 United States Census. Rather, at that point in time, the primary driver for this kind of distribution mapping was related to economic interests.
Sargent compiled information for about 412 tree species, which appeared in a voluminous final report, published in 1884. Some of this information came through personal field observations, but Sargent also enlisted the support of a team of botanists and natural history enthusiasts who traveled through specific regions, reporting on the composition of the forests. Most of the resulting distribution information was text-based, but the report also included several types of maps: One set showed the extent of forested landscapes for individual states. Another set, included as a large-format portfolio, showed the distribution of genera, like pines (Pinus) or oaks (Quercus), on a continental scale, with monochromatic shading used to indicate the number of species in each location. All the maps were prepared by Andrew Robeson, Sargent’s brother-in-law.
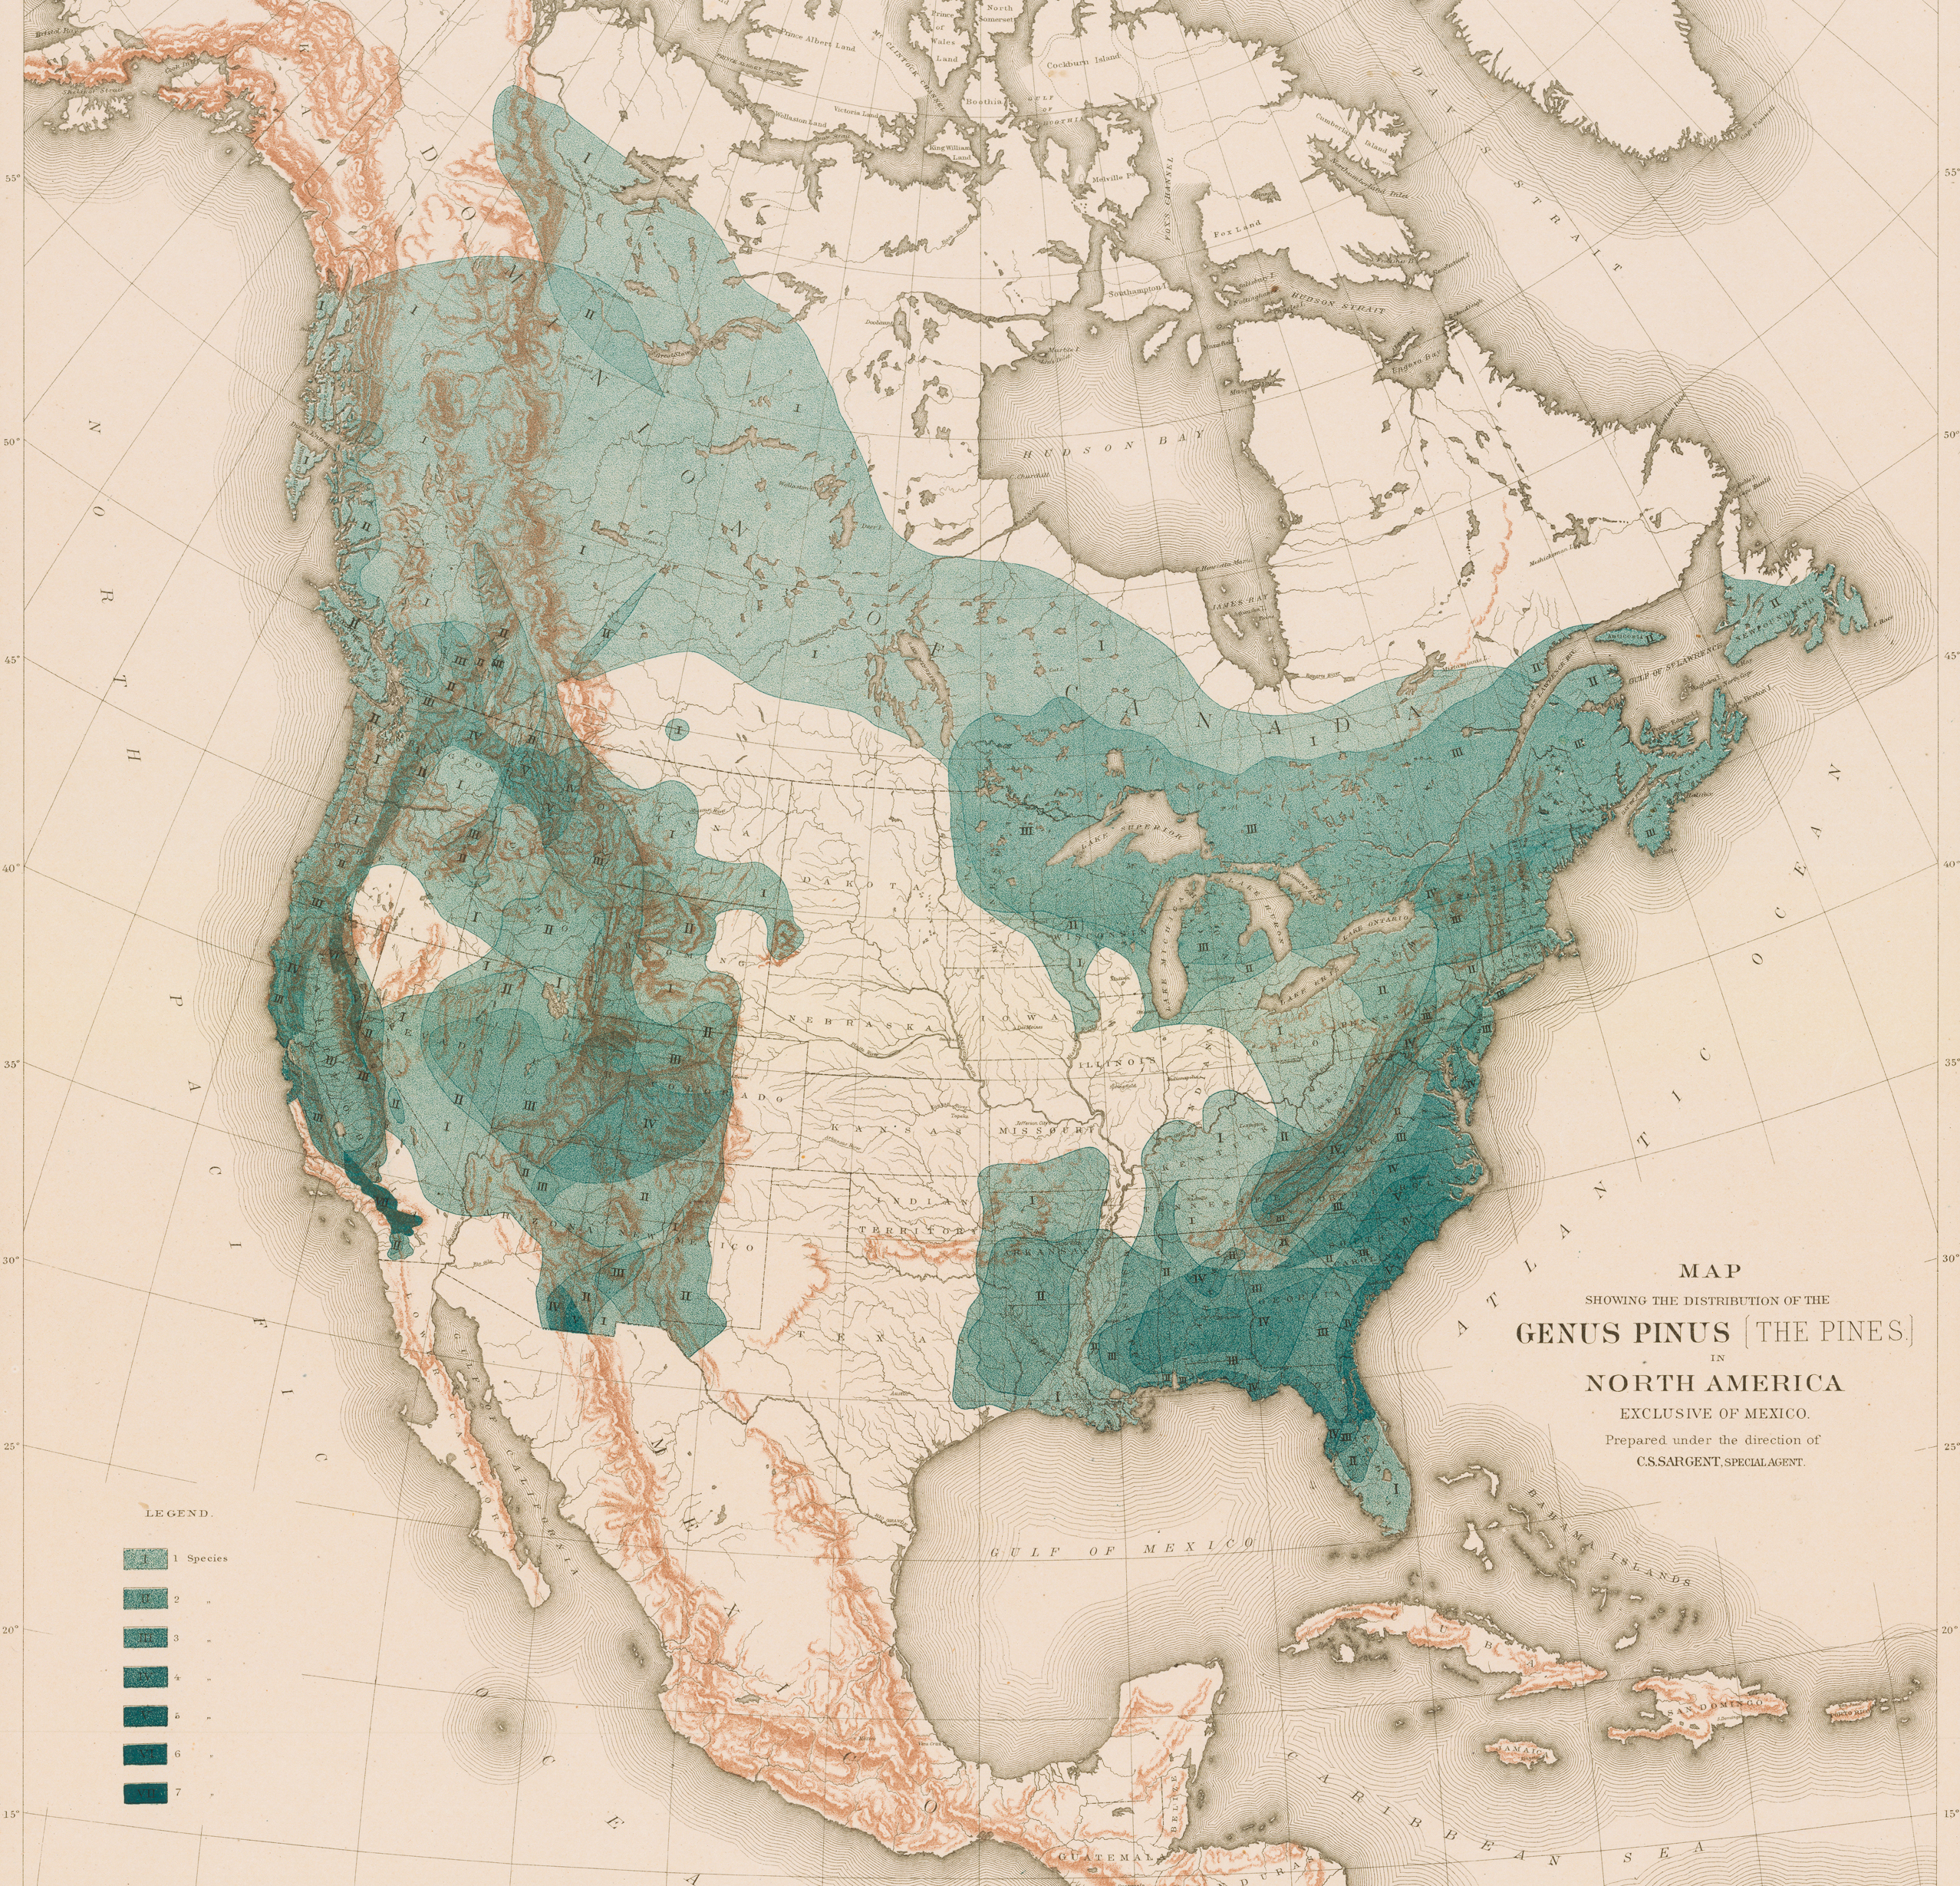

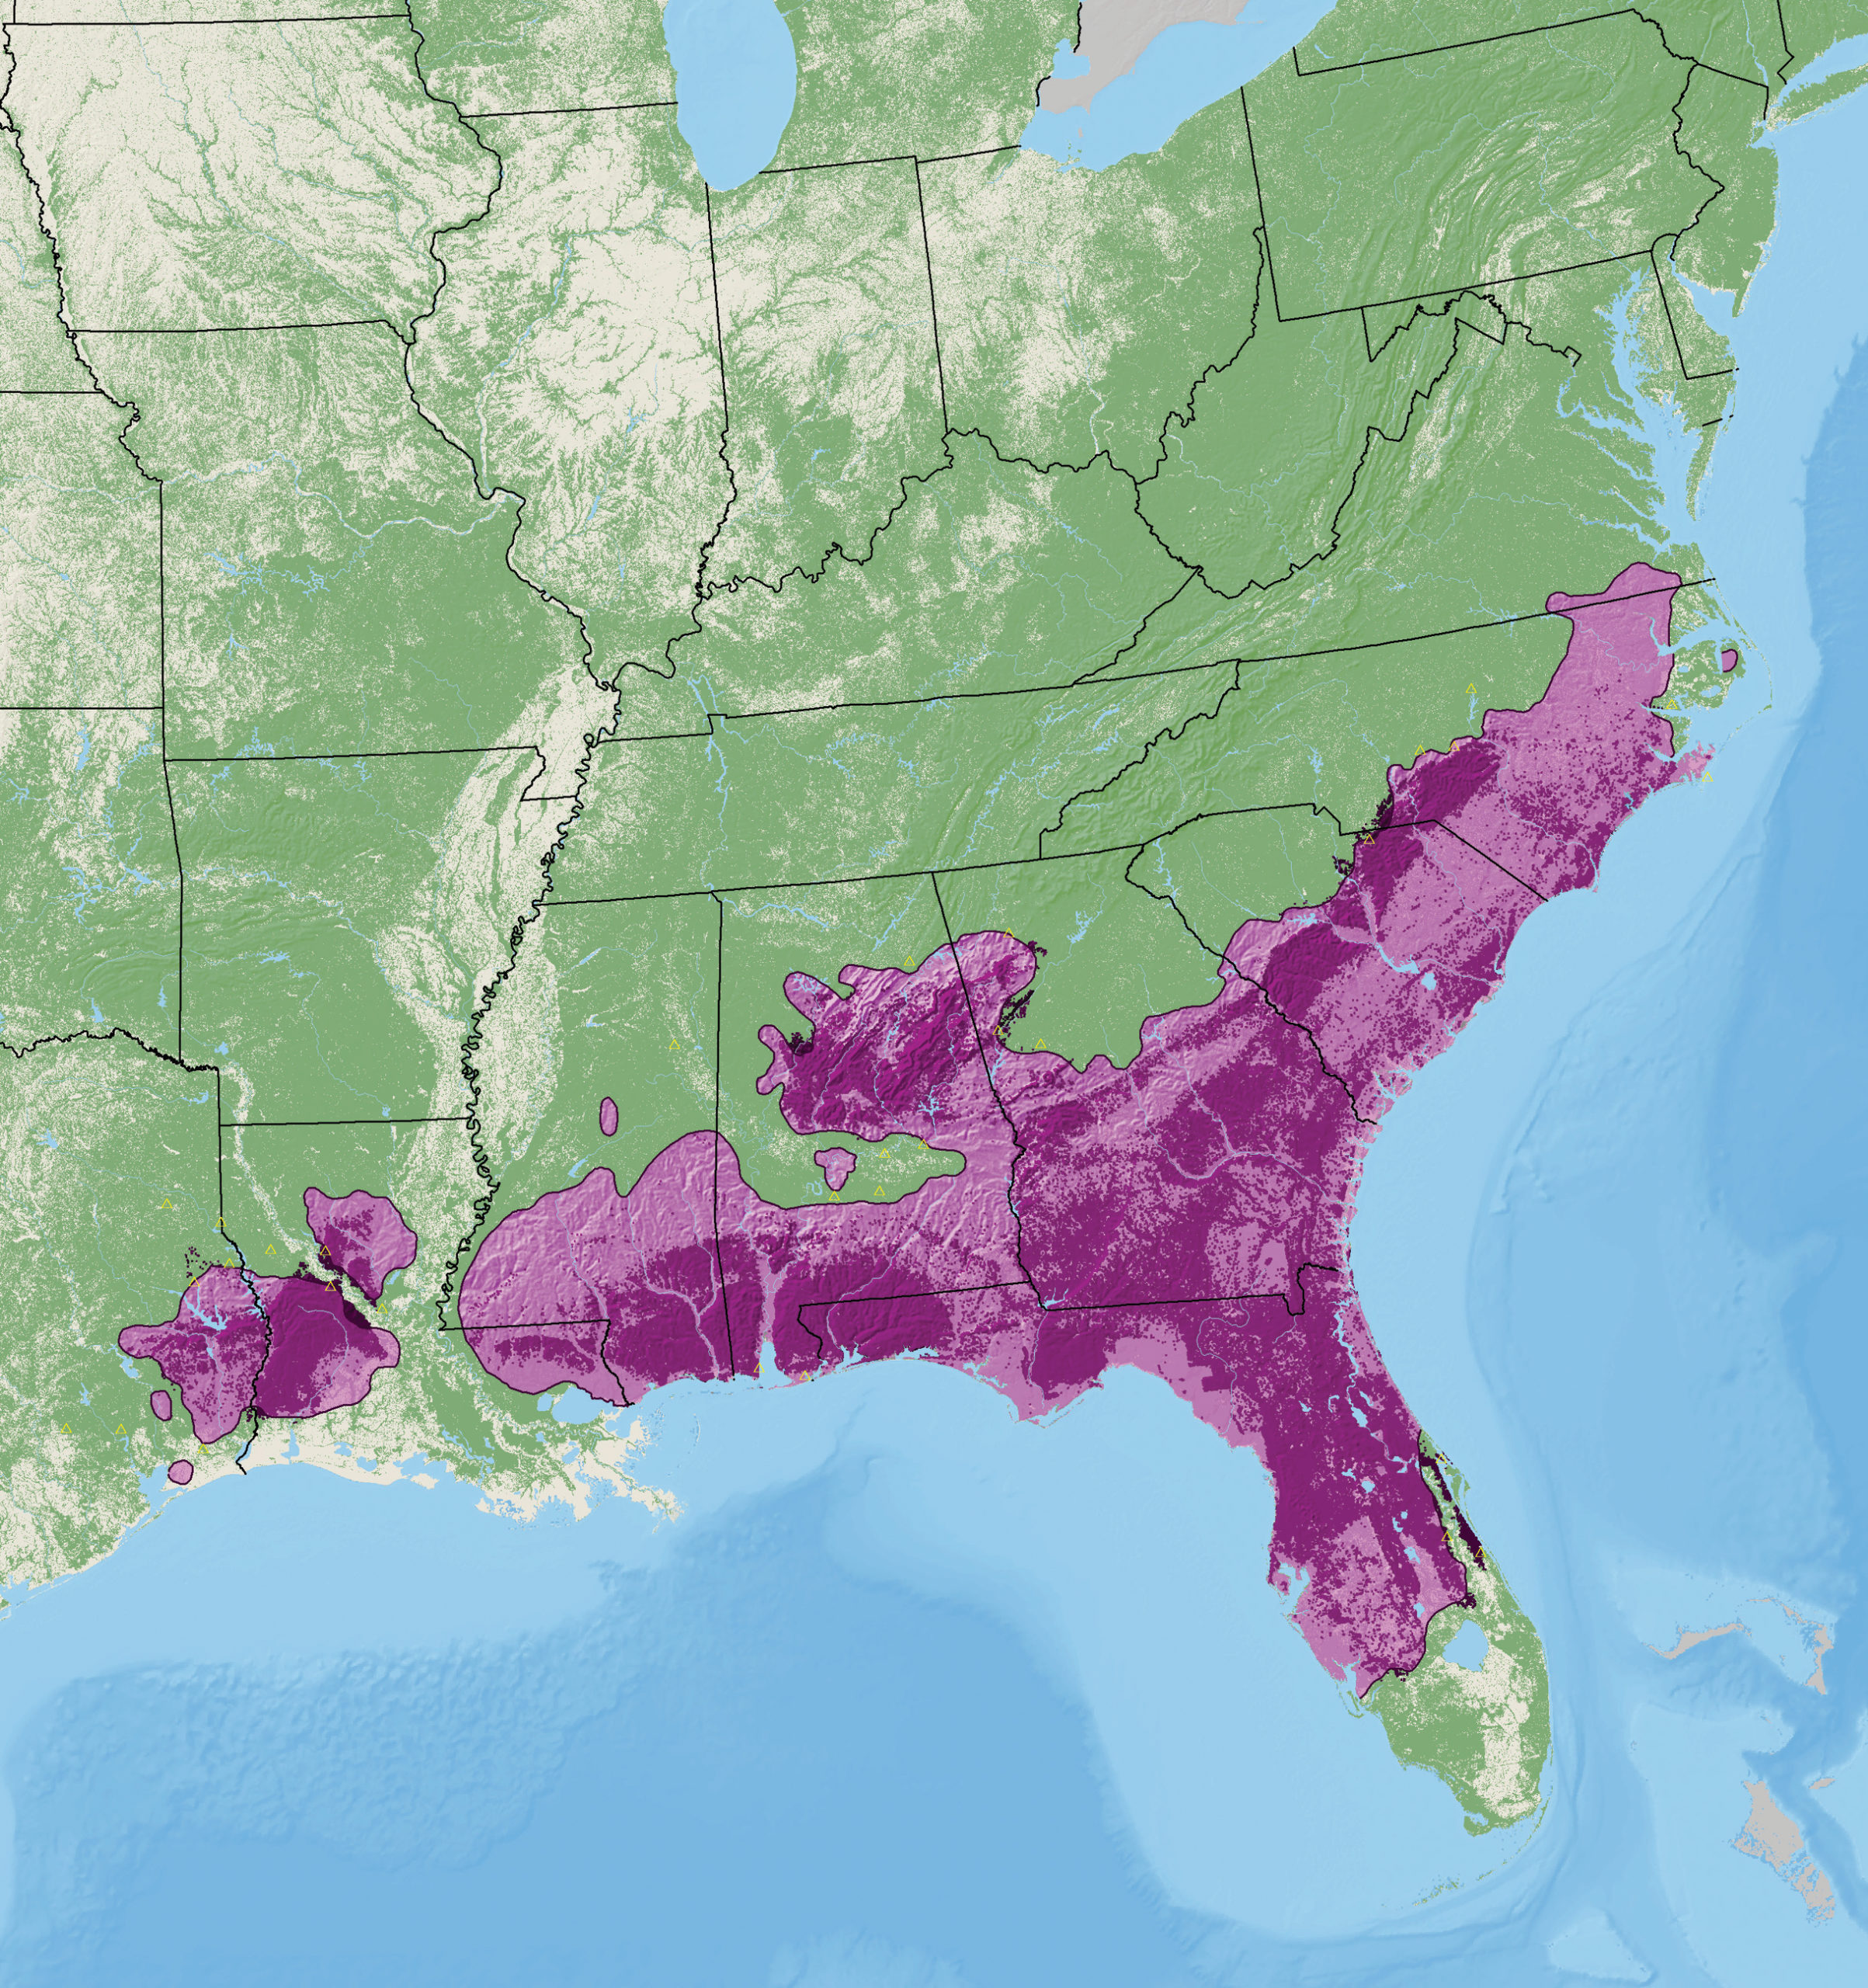
It is particularly interesting to look at how the census report renders a single economically important species, like the long-leaf pine (Pinus palustris). Sargent called the species “a tree of first economic value” and described a distribution that spanned from southeastern Virginia, through the Gulf states, and into eastern Texas, “rarely extending beyond 150 miles from the coast.” On maps of the corresponding states, long-leaf pine was singled out for more detailed representation, and the maps also indicated “regions from which Mercantile Pine has been removed.” Farther west, individual species were not tracked on the state maps, which instead showed the density of forests. Likewise, the supplementary map for all pines indicated only the density (essentially a heatmap) rather than showing the ranges for individual species. As such, if someone wanted to determine the scattered range for something like the whitebark pine (P. albicaulis), which favors subalpine regions in the western mountains, the text-based descriptions would have been the best resource. Of course, individual species maps would have required many more field observations than were currently available. A large region in the center of the Idaho census map was still labelled “unexplored,” which now offers an evocative reminder of this information scarcity.
While the census project was nearing completion, Sargent simultaneously chaired an initiative to preserve woodlands in New York’s Adirondack Mountains from deforestation, which culminated in the establishment of Adirondack Park—the country’s first state forest preserve—in 1885. It is clear that Sargent was aware of the utilitarian value of the census project, given that more than two hundred pages of the final report were devoted to the material properties of wood derived from each species, yet mapping the forests also revealed the finite dimensions of a resource that had once seemed limitless, potentially setting the stage for subsequent conservation and preservation movements.
Developing Detail
While the census report provided a useful synthesis of information known at the time, by 1898, George Bishop Sudworth, a dendrologist for the United States Department of Agriculture’s Division of Forestry, articulated the need for a more comprehensive and up-to-date treatment of distribution information. “The army of professional and amateur botanists engaged in botanical research are yearly bringing to light new facts, which are constantly enlarging our understanding of the geographical distribution of trees and other plants,” Sudworth wrote in the first edition of his Check List of the Forest Trees of the United States: Their Names and Ranges, which was published that year. The checklist included short descriptions of the ranges for five hundred species, but he knew that much more collaborative work was still needed.
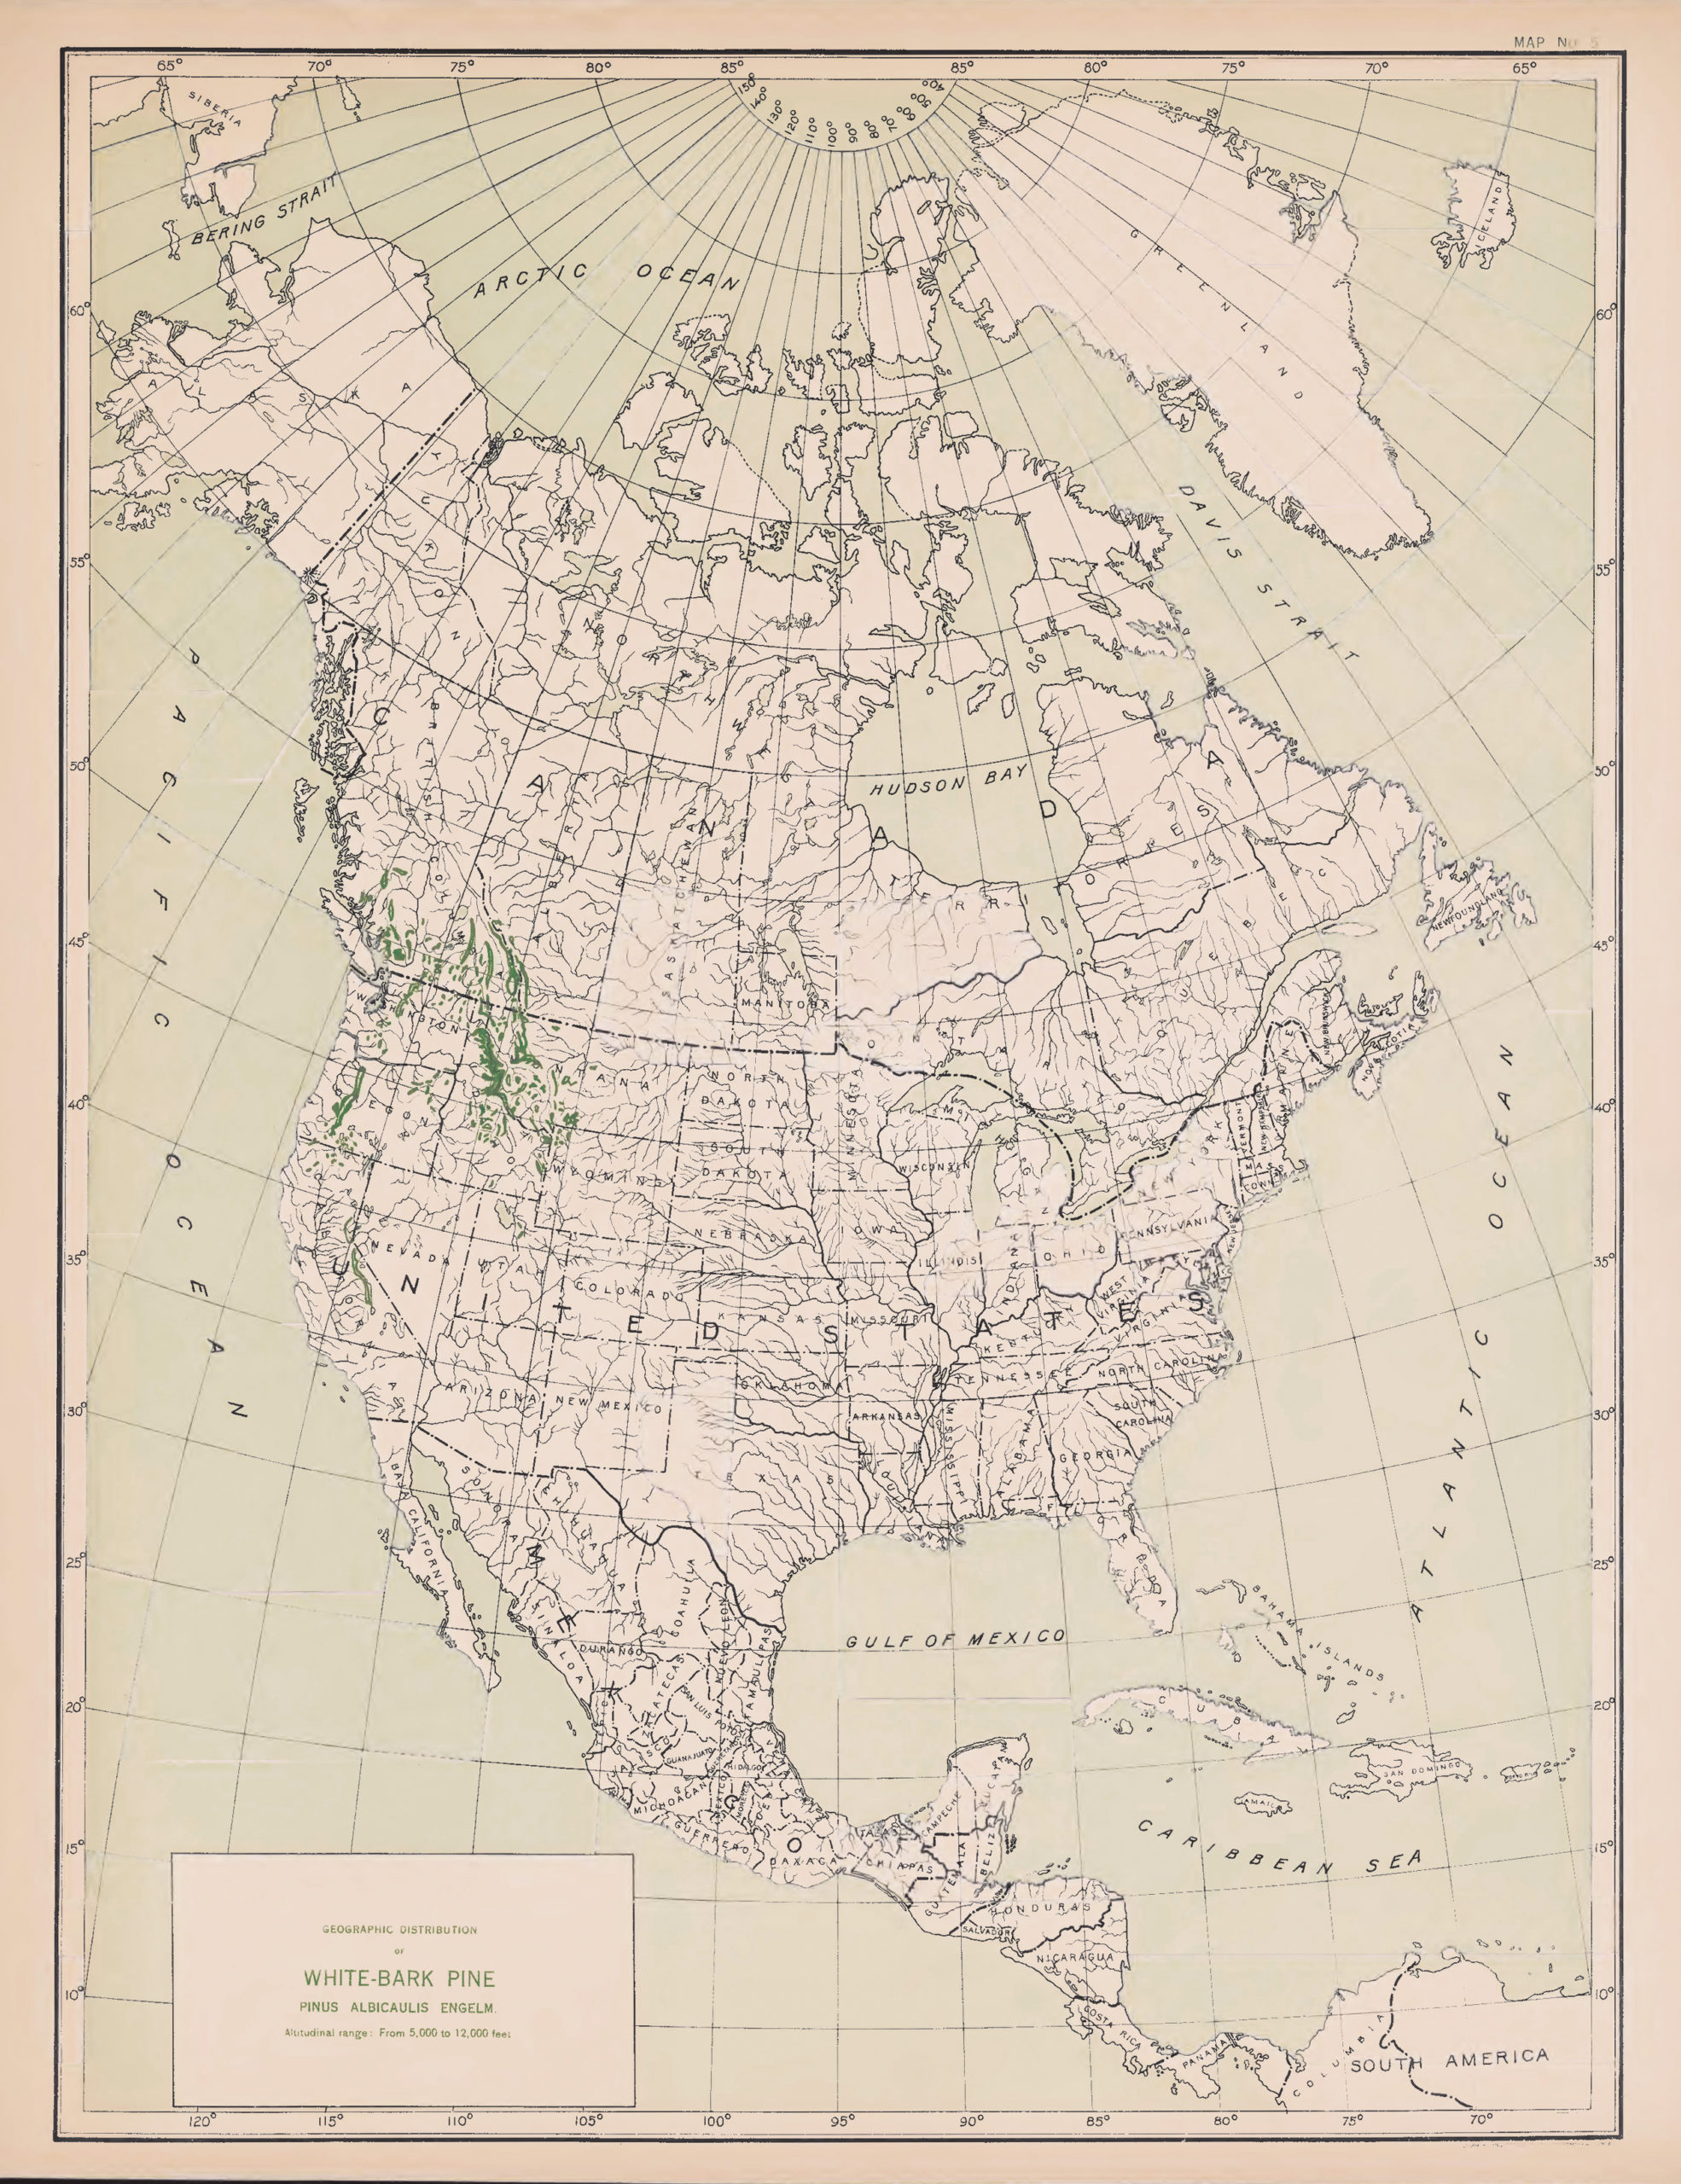
The 1898 checklist ultimately presaged Sudworth’s lifelong effort to develop better species distribution maps. Significantly, in 1913, Sudworth published an atlas for North American pine species, which was intended to be the first volume of a series covering all native trees. These maps represented a significant step towards the familiar appearance of distribution maps today, with each species rendered on a single map showing the entire range. Sudworth even showed the distribution of relatively sparse species like the whitebark pine, with green marking that followed the narrow elevational bands along mountain ranges. Given the scale, a reader would have difficulty in seeing the range for whitebark pine without the use of visual aids such as a magnifying glass, but the effort suggests the amount of detailed field observation that went into the project.
Sudworth attributed the success of his maps to work being conducted by the new United States Forest Service, established in 1905, which provided invaluable “unpublished field notes, unrecorded observations, and reports of Forest Service officials engaged in the exploration, surveying, and administration of the 163 National Forests now established.” Sudworth’s assistants compiled information from these sources, along with state floras and other resources, on cards for each species, and these annotations were plotted on a map of North America. Sudworth knew that the simplicity of maps far exceeded the usefulness of even the most detailed text, yet his volume on pines was the only portion of the atlas ever published.
The explanation for Sudworth’s discontinuation of the atlas project might be intuited from the publication of subsequent bulletins that included maps of select tree species (including additional conifers) in the Rocky Mountains. Given that much of Sudworth’s field information arrived from the National Forests, which were almost entirely located in western states (at the time), it makes sense that the maps would ultimately share the same regional emphasis, with special attention given to species that were of economic importance.
In 1927, the year of Sudworth’s death, he published a revised checklist of North American tree species, in which he briefly described the range for every known species at the time (adding more than three hundred taxa to his original checklist). Sudworth knew the information would prove useful “not only among foresters, woodsmen, and wood users, but also in forest schools and other educational institutions.” At the time, he and an assistant were once again working on maps—with many complete but unpublished—but the effort was suspended as priorities shifted (perhaps related to the Great Depression).
Developing Breadth
Edward Norfolk Munns, the chief of the Forest Service’s Division of Forest Influences, eventually returned to the work that Sudworth and his assistants had started. In 1938, he published an atlas covering 170 of the most important tree species, which he noted was “based very largely” on Sudworth’s research, with many updated observations compiled by junior forester William W. Mitchell. Although the species representation was far greater than anything published in Sudworth’s lifetime, critics suggested that the maps should have been shared with field botanists and foresters for additional corroboration, because to many working on the ground, errors were evident. Even so, the atlas was reprinted by popular demand.

Beyond utility for botanists, foresters, and “the manufacturer in search of raw materials,” Munns also described new ecological and engineering implications for the maps, no doubt based on his early field experience studying the impact of wildfires on California watersheds. “[Forest distribution] is an essential element in erosion and flood control operations, and in land-use planning,” he wrote in the introduction. “Indeed, present trends toward better planning and integration of land use are directing increased attention to forest cover, the species represented in it, and the possibilities of enlarging the contribution of forest land to community welfare.” This, of course, may have been a suggestion that worked better on paper than in practice, but the statement represented an important expansion of what distribution maps could enable.
Ultimately, in 1942, a forest ecologist name Elbert Little Jr. was appointed as dendrologist for the Forest Service. Like both Sudworth and Munns (and myself), Little had spent a considerable amount of time at Forest Service field stations in the West, before taking his appointment at the national office in Washington. Little’s continuation of the mapping project began with small generalized ranges for 165 forest species of economic interest, published in 1949. He later explained that the small size of the maps was due to practical and logistical reasons, given that it is easier to approximate an accurate range at a smaller scale. “Botanists, foresters, and other authors bold enough to summarize plant distribution records graphically may expect criticism instead of reward for their efforts,” he wrote in a follow-up article in Rhodora. “It is far easier to detect a minor flaw along a boundary line than to prepare a better map.” I learned this lesson very quickly in my own endeavors, to say the least.
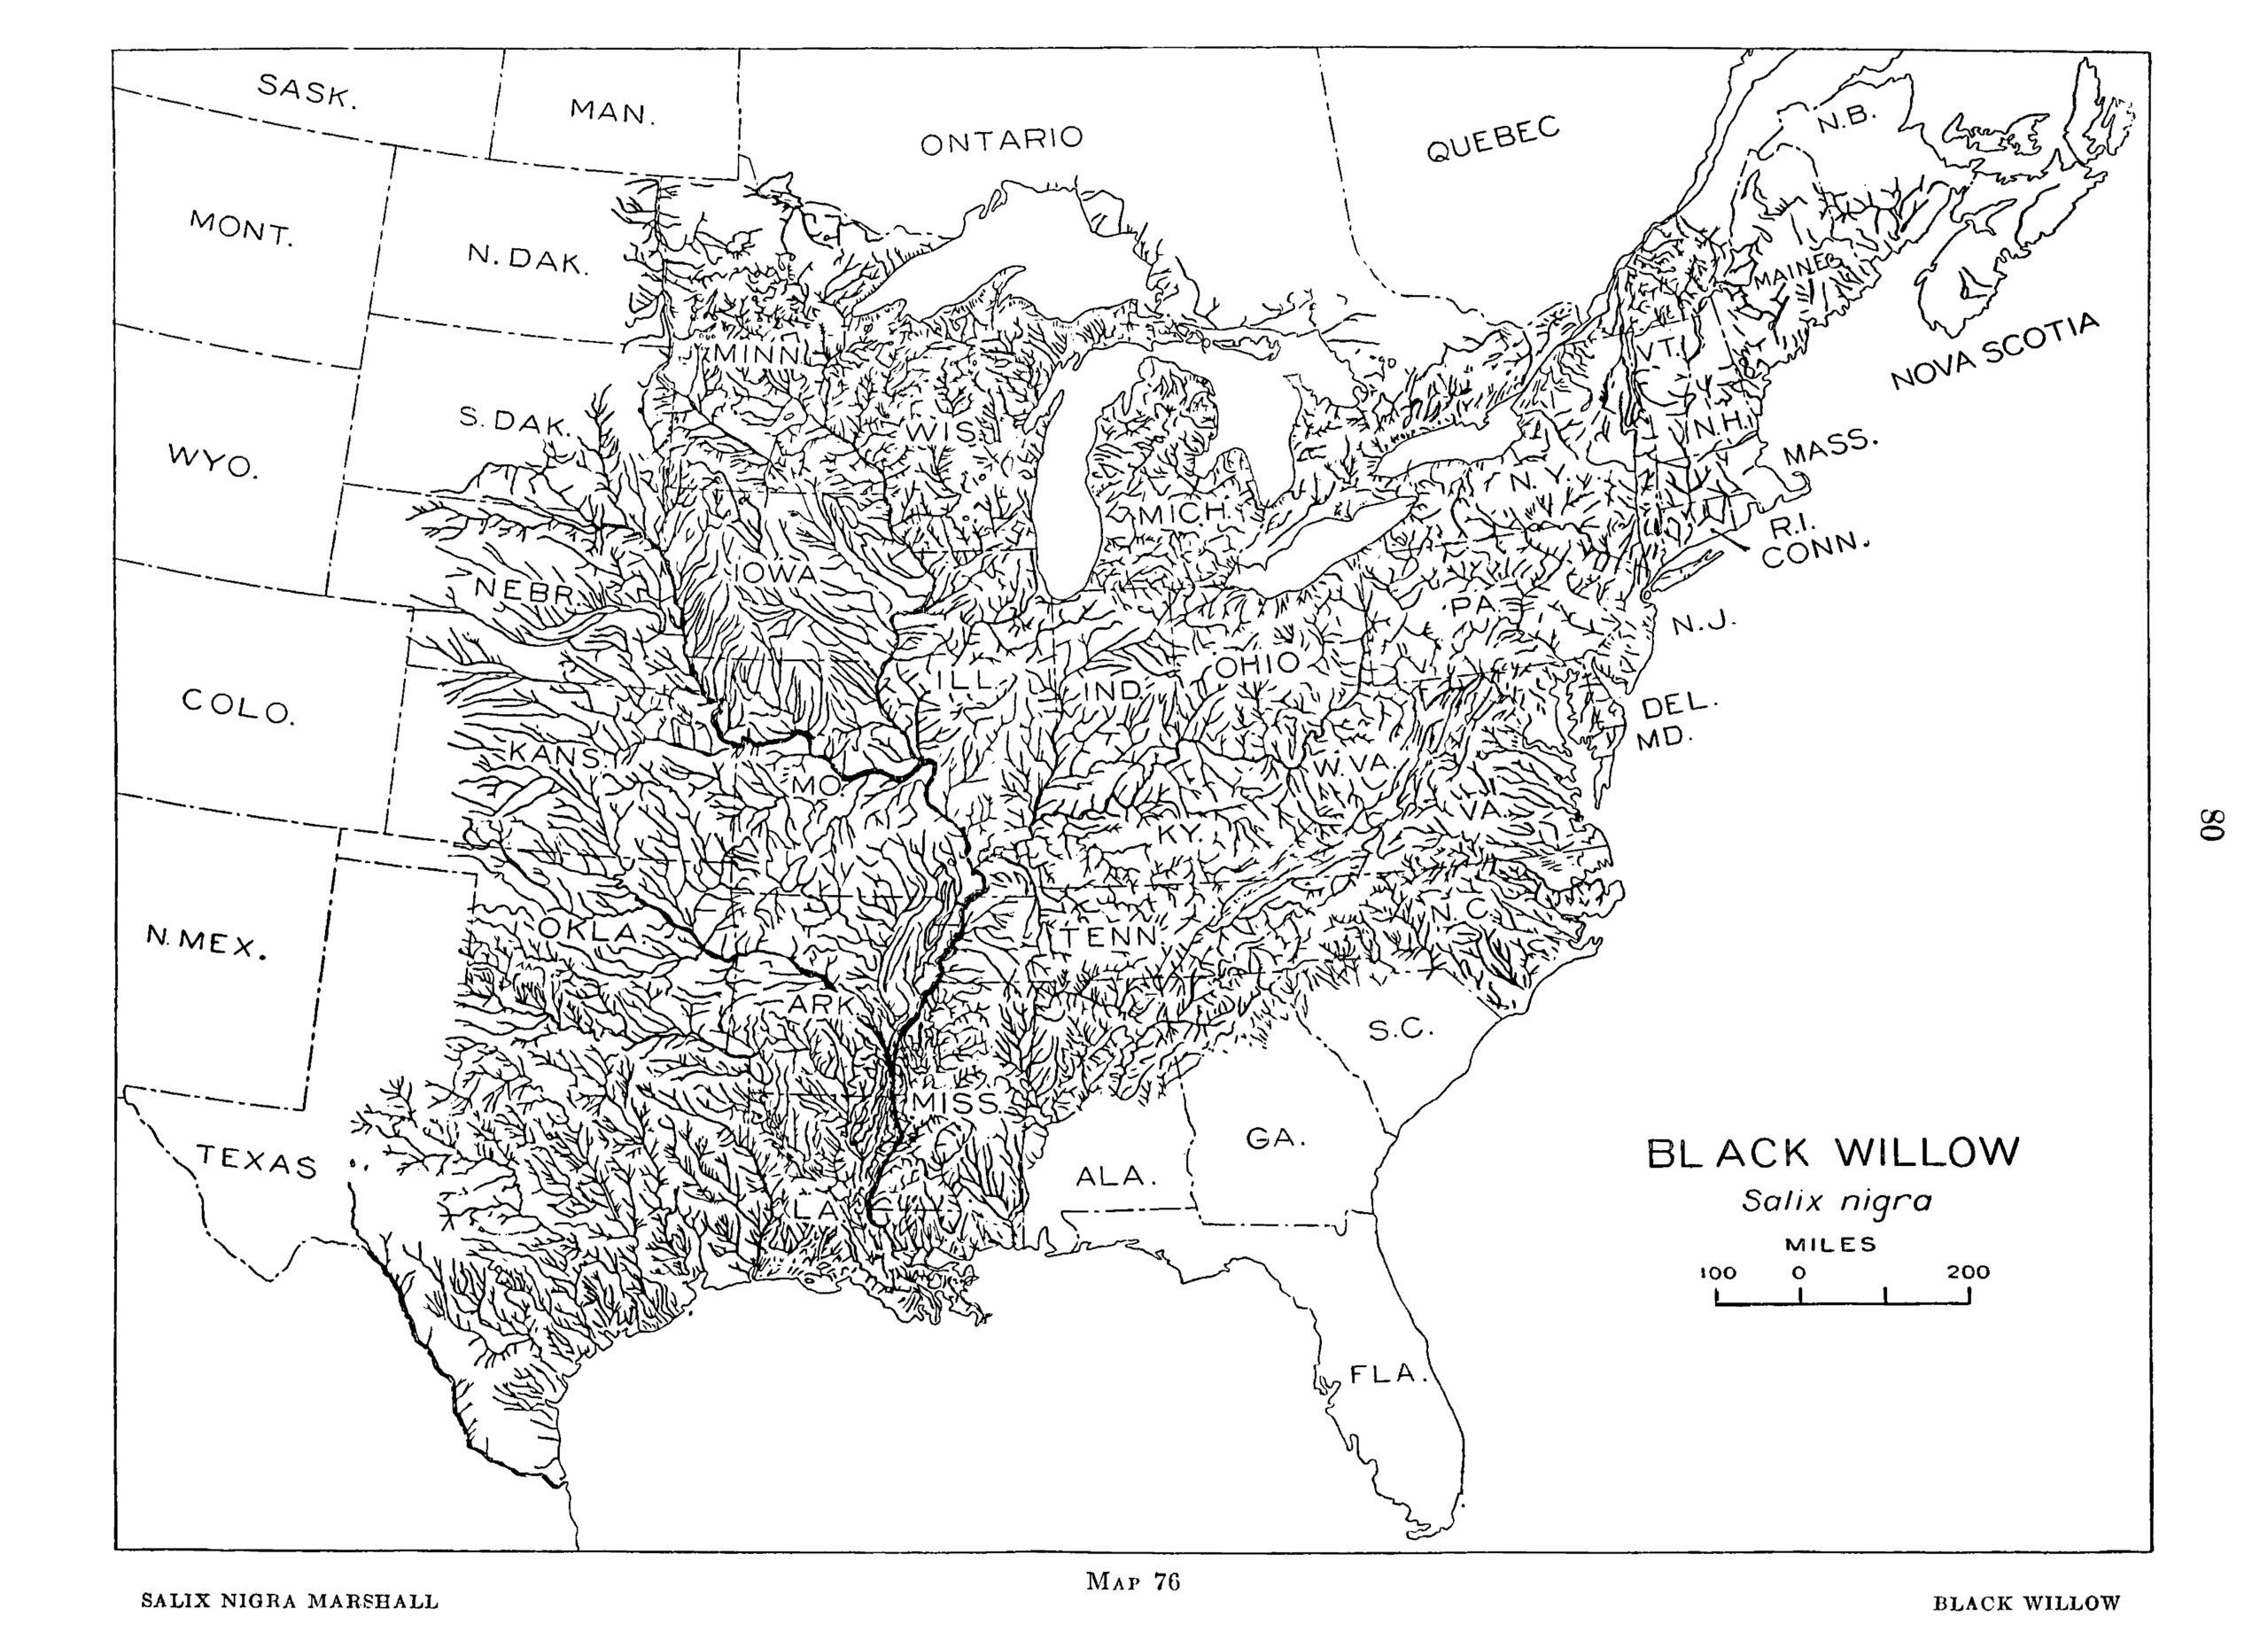
Over the next two decades, Little and his assistants worked rigorously to expand the distribution data, sifting through more than three hundred sources, including unpublished card files in state herbaria and doctoral dissertations. Like Sudworth’s maps, the reference points were then plotted onto a map of the United States or North America. The first volume appeared in 1971, and the next five volumes appeared over the next ten years, ultimately covering more than seven hundred species of trees and major shrubs. When Little published on the distribution of trees in Alaska, he retained the individual reference points within the distribution outlines, but otherwise, the maps generally followed the classic form, with a simple outline drawn around all contiguous populations. This work still represents the standard reference for tree species ranges in North America today.
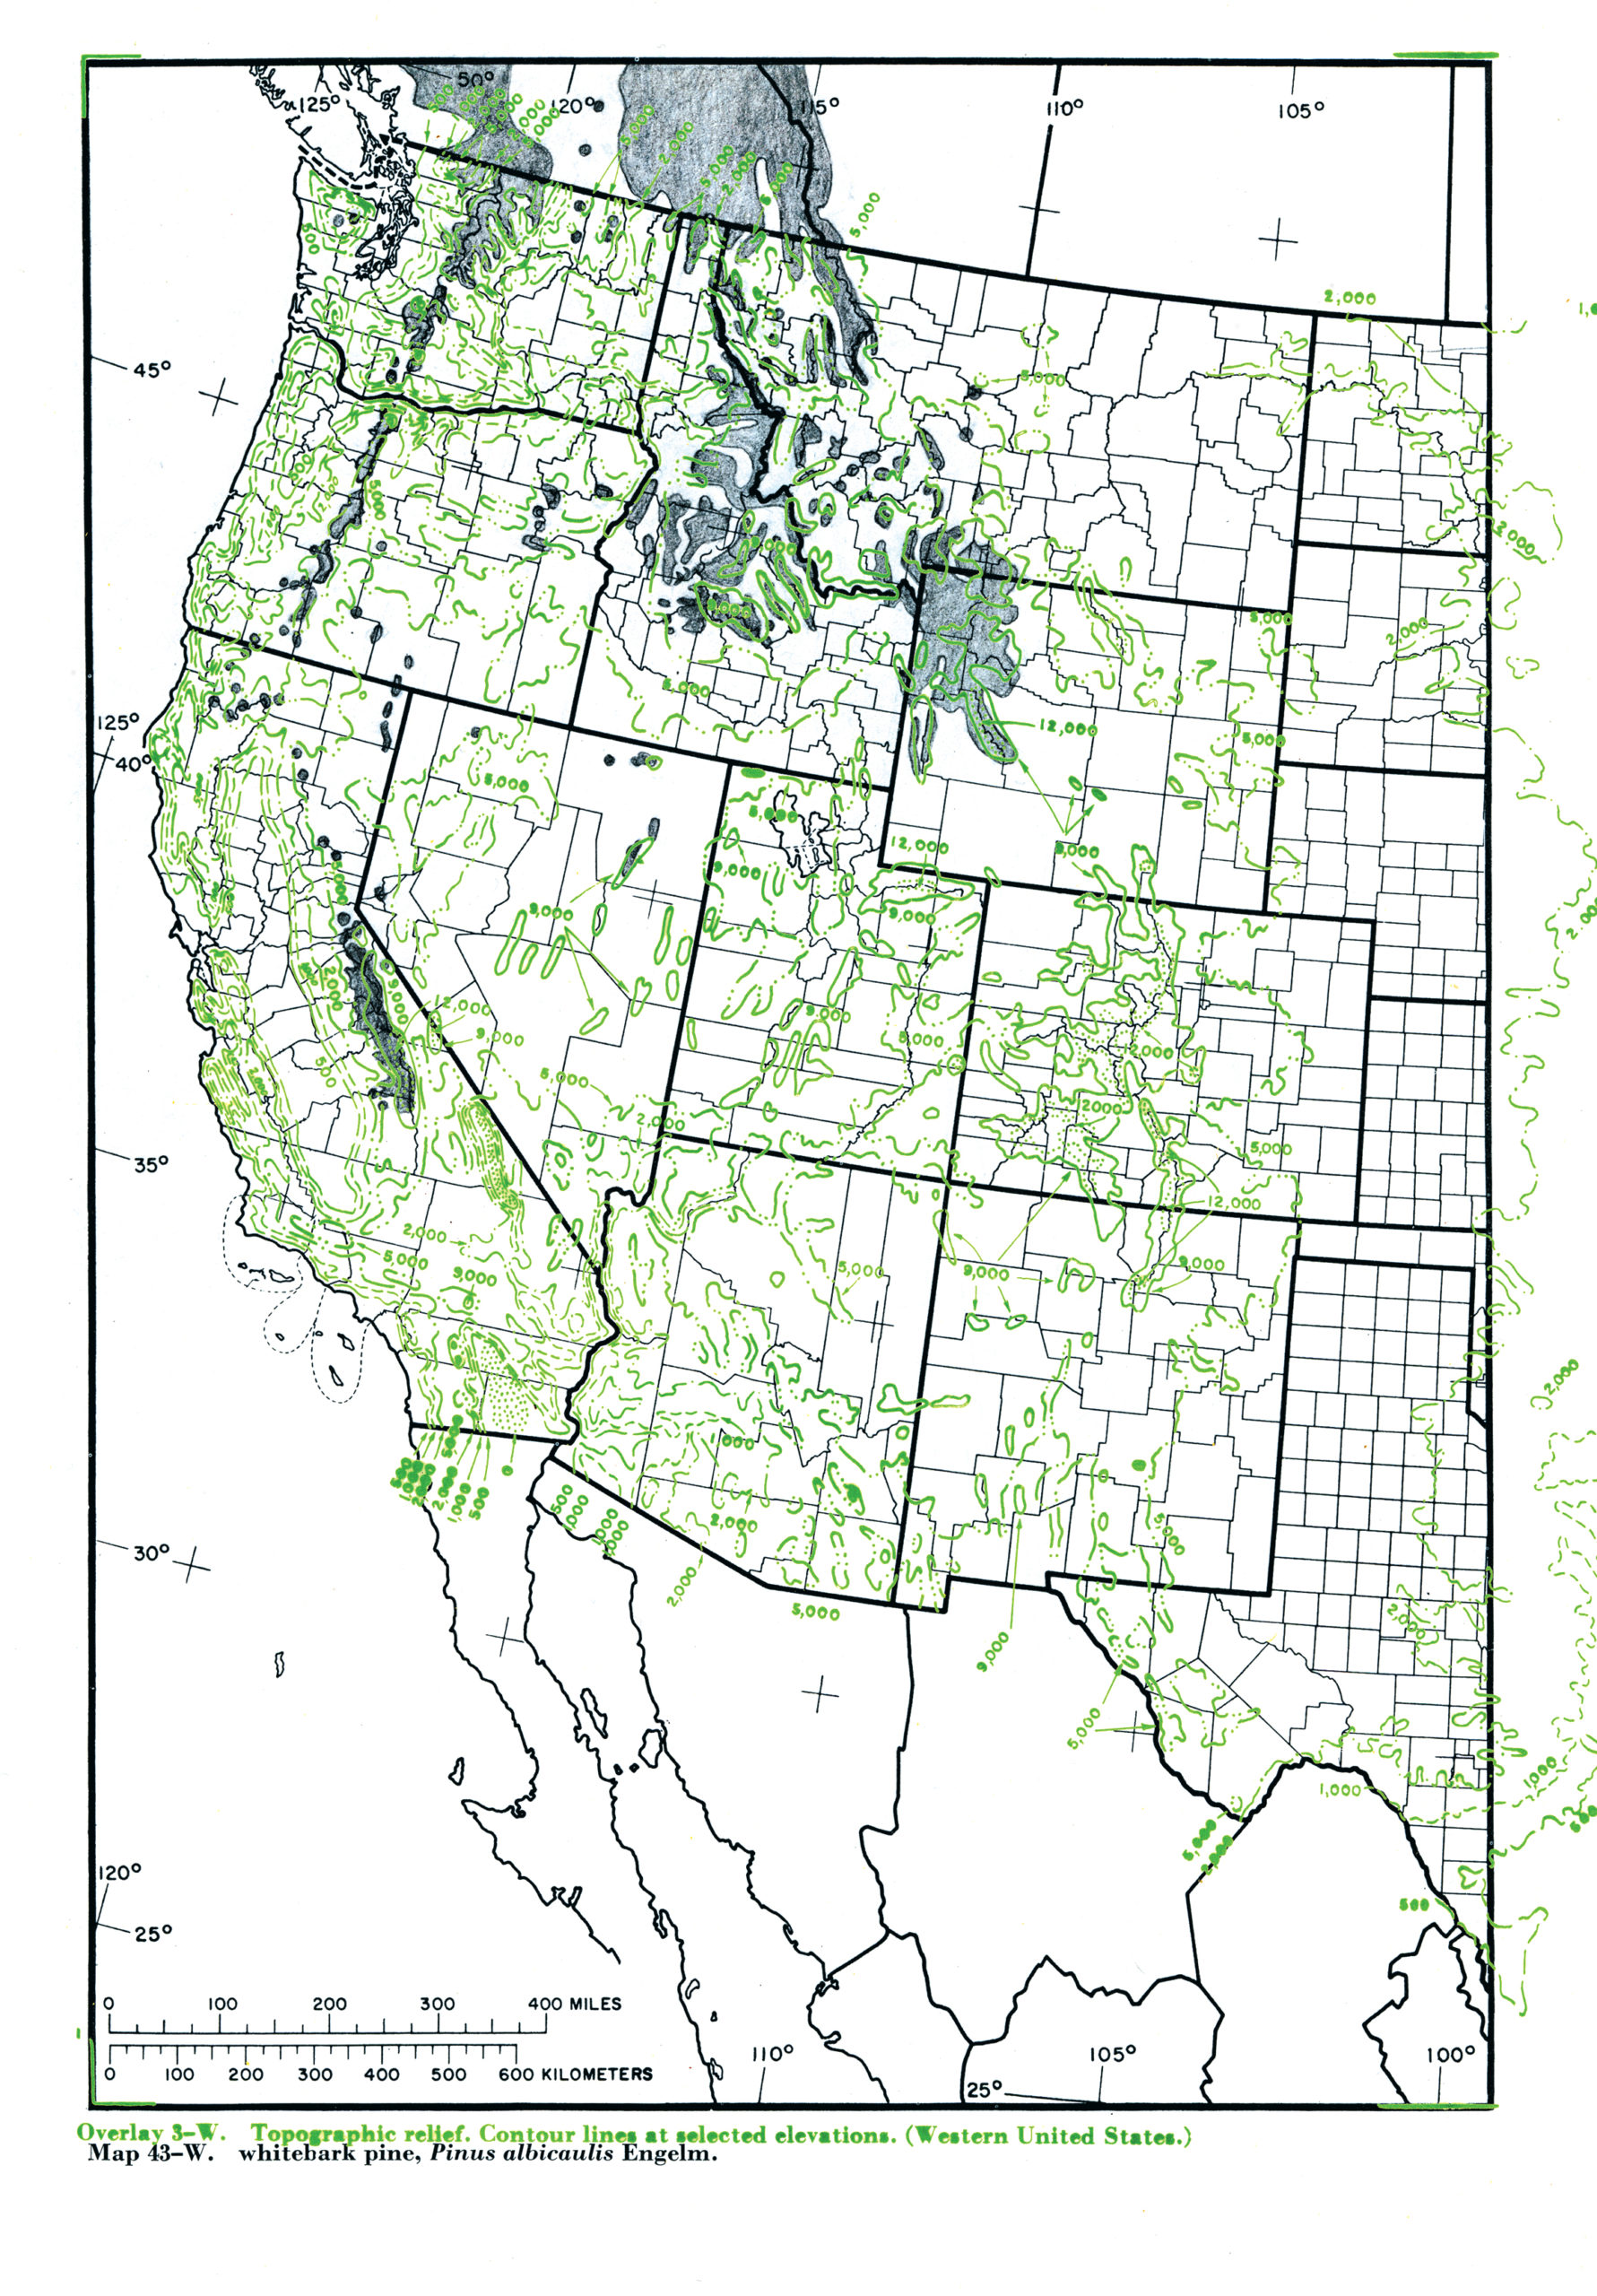
The first volume of the atlas also included nine semi-transparent overlays, nested within a cover pocket, which could be superimposed over the range maps. The overlays included features like “precipitation and rainfall,” “plant hardiness zones,” and “maximum extent of glaciation in the Wisconsin Glacial Stage.” While the subsequent volumes did not include these transparencies, the originals could be used with two of the other volumes. If Munns, therefore, alluded to the possibility of using the distribution maps for something beyond a guide to natural resources, Little’s transparencies indicated a genuine commitment to expanding the types of questions that could be raised with the maps. “They provide the basis for correlation studies of distribution of a species and the environment,” Little wrote of the overlays (in the fourth volume). Moreover, as someone who began his career as a forest ecologist, Little saw a greatly expanding set of research questions that would benefit from the maps, including “such studies as classification, evolution, paleobotany, and genetics, and for the distribution of associated animals and plants, especially insects and parasitic fungi.” Although the transparencies may seem simple compared to modern approaches, the effort to enable comparisons between tree species and environmental conditions represents a milestone development.
Once published, Little worked vigorously in trying to maintain an authoritative record for each individual species, even after retirement. A colleague of his related a story of visiting an area in Wisconsin in the 1980s where there was a rumor for the occurrence of a species that wasn’t depicted in the atlas. Little brought his field maps, confirmed the sighting, and promptly penciled in the location. Eventually, the field maps were brought back to the office for inclusion in the authoritative maps. Little stressed the importance of continual maintenance. His coauthor on the second volume, Leslie Viereck, continued to maintain records for Alaska and produced a second edition, which included range adjustments, some species reclassifications, and an expansion to include significant shrub species. It was unfortunate that Viereck passed away in August of 2008, about a year before we started on the finer scaled species distributions.
Modelling the Present
After Little retired from the Forest Service in 1975, the position of dendrologist was unfortunately abolished. In the ensuing decades, ecosystem classifications became the mapping priority. Communities of trees were identified as the dominant factors necessary for analyzing impacts of forest management, and distribution maps for individual tree species were no longer emphasized. With shifting priorities, staff changes, and a relocation of the National Headquarters, the whereabouts of Little’s authoritative maps was lost through the ages. Although I have encountered people whose tenures overlapped with Little’s, it is likely that the data have been forgotten, left in an attic, or moved to a storage facility at the Department of Agriculture’s Greenbelt center or to a National Archives and Records Administration facility. If these data are recovered in the future, it would be important to appropriately curate them for further refinement and research.
In some disciplines, however, the need for better species maps became critical. Given practical considerations, Little was required to take inherent liberties when connecting a distribution outline around scattered dots, and the resulting shapes also failed to convey the density of forests. Moreover, the maps no longer represented the best information about the current distributions. Limitations like this are inherent to the mapmaking process. Even Sudworth, writing in 1913, noted the forests were changing faster than the maps could show. “Extensive and continued lumbering operations with attending forest fires have so changed, and in some cases exterminated, parts of the original stand of most of our pines,” he wrote. “These maps, therefore, indicate only the general occurrence of species with the prescribed areal limits, and have no reference to the density or continuity of growth.” Munns made the same point twenty-five years later, and Little echoed these concerns.
These limitations ultimately fueled my work with the Forest Service’s Forest Health Technology Enterprise Team, where we needed to develop models to predict the risks associated with forest pests. We obtained current observations of 346 species that occur at Forest Inventory and Analysis field plots, as well as from other permanent plots managed by the National Forest System and the Bureau of Land Management. This amounted to more than 330,000 plots (and more than 1.2 million subplots). We linked this information to predictive layers pertaining to environmental variables like climate, terrain, soils, and satellite imagery. This dataset was then used to model individual species presence, as well as stand density, which was necessary for pest risk mapping. In the end, we successfully modelled the distribution of 264 trees sampled on these Forest Service plots, and as a by-product of that work, we published the National Individual Tree Species Atlas in 2015. Of course, this printed document will ultimately become a historical artifact, much like Little’s volumes, given that the forests in the country will continue to change and transform in response to disease and insect pressure, climate change, habitat destruction, disturbance recovery, and any number of other threats (or boons), many still unforeseen.
The difference between the distributions shown on Little’s maps and our models is often quite noteworthy, so our published atlas also includes Little’s outlines for comparison. It was my hope that this format would draw awareness to the ongoing need for studying these ranges—work that might require the oversight of a twenty-first-century Little (an authoritative steward of tree species distribution data)—however, even now, no specific authority is responsible for maintaining comprehensive distribution records. The United States Department of Agriculture’s Natural Resources Conservation Service maintains the PLANTS Database, which has some degree of authority, although species distributions are only tracked at the county level, at best, which is adequate for general applications but not for applications in need of a finer scale.
For many species, like the long-leaf pine, comparison between the models and Little’s maps suggests range contraction. The same is true for the whitebark pine. Both species are recognized as endangered, according to the International Union for Conservation of Nature, although for different reasons. The long-leaf pine was eventually disfavored by the forest industry due to its lengthy sapling (“grass”) stage, and as a result, commercially managed forests were preferentially replanted with loblolly and slash pines (Pinus taeda and P. elliottii, respectively). The species is still threatened with continued habitat loss, although substantial restoration efforts are underway. Whitebark pine is currently most threatened by recent outbreaks of mountain pine beetle (Dendroctonus ponderosae), a native insect that has caused widespread mortality among western pine forests. In both cases, the models are critically important for monitoring current populations, as well as for projecting the future of these populations.
Other species, like the Osage orange (Maclura pomifera), however, show a dramatic range expansion. The range shown on Little’s map is an upright column running through eastern Texas, barely extending into southern Oklahoma and Arkansas. Little wanted to show the original range for the species, before it had been widely planted as a living fence between agricultural fields in the Midwest. Because the species readily naturalized, our models, based on information about actual occurrence at field plots, shows a much wider range, with populations as far afield as western Pennsylvania. Our atlas also includes ranges for three nonnative species—tree of heaven (Ailanthus altissima), Chinese tallow tree (Triadica sebifera), and empress-tree (Paulownia tomentosa)—which have naturalized widely. Since these ranges weren’t recorded in Little’s atlas, this will provide invaluable baseline information for future management and research efforts.

Changes to species classification can also result in significant changes to the distribution maps. The bristlecone pine, for instance, was separated into two species—Rocky Mountain bristlecone pine (Pinus aristata) and Great Basin bristlecone pine (P. longaeva)—which were easily separated based upon geographic data. Other species classification changes were not so easy. The Mexican pinyon pine (P. cembroides) was divided into two additional species, border pinyon (P. discolor) and papershell pinyon (P. remota), but the distributions were much more difficult to separate due the coincidence of the three species.
As the inventory is maintained, newer modeling techniques can improve the distribution maps for only the species measured on an inventory plot. Other naturally occurring species—often those with more restricted ranges in the first place—will need different data sources and greater effort to be developed.
Beyond Borders
While developing our models, we had the privilege of working with colleagues in Mexico to develop pest risk maps for Douglas fir (Pseudotsuga menziesii) and several key pines. Though we limited our investigation to eight species that had coarse climate and soils data, the permanent inventory for Mexico is designed much like the United States, and the potential exists to develop a complete set of species distribution maps for Mexico. (It should be noted that while 387 species were encountered within inventory plots in the United States, the Mexico inventory counted over 3,000 tree species.) Meanwhile, the resolution of our information does not carry into Canada, given limited access to the same amount of field data. Canada produced distribution maps for approximately ninety-three species, although they are of limited precision compared to the maps in the United States. At present, however, our own models don’t extend north of the border either. In this sense, political relationships are often implicit in distribution maps, much as economic and ecological imperatives have manifest themselves throughout this ongoing history.
Given the nature of remote sensing, however, there is increasing potential to combine forest inventories to map complete species distributions, regardless of political boundaries. The North American Forest Commission is currently developing a combined database for Mexico, Canada, and the United States, and the success of a shared system like this was recently demonstrated in Europe. The European Union published the first systematic atlas of trees at the continental scale in 2016, which grew out of an effort to harmonize data within a continent-wide forest information system, established in 2013. Although the authors stressed the need for even more data (collected using more consistent methods and metrics), the resulting atlas is testament to the achievements possible with international collaboration. Moreover, the Food and Agriculture Organization of the United Nations asks all countries to assemble a National Forest Inventory every five years, and although the distribution data are relatively coarse, efforts like this suggest the potential for a much more comprehensive set of tree species maps, especially in temperate regions where species diversity is less complex.
Taken together, these aspirations suggest the longevity of Sudworth’s observations in 1898. “The geographical range of any of our trees must necessarily be an expression of the united efforts of all working botanists,” he wrote, “for the unaided diligence of one man’s lifetime could never carry his search and study into all of nature’s hiding places for even trees alone.” Since the completion of the National Individual Tree Species Atlas, many changes have occurred that would enhance future modeling efforts. Modeled maps now have the potential to be dynamic and adaptive, but they still require the collaborative vision of botanists, foresters, and plant ecologists in the field, now and for generations to come.
References:
Beaudoin, A., Bernier, P. Y., Villemaire, P., Guindon, L., and Guo, X. J. 2017. Species composition, forest properties and land cover types across Canada’s forests at 250m resolution for 2001 and 2011. Quebec: Natural Resources Canada, Canadian Forest Service, Laurentian Forestry Centre.
Ellenwood, J. R., Krist F. J., and Romero, S. A. 2015. National individual tree species atlas. Washington, DC: United States Forest Service, Forest Health Technology Enterprise Team.
Little, E. L. 1949. Important forest trees of the United States. In Trees: The yearbook of agriculture. Washington, DC: United States Department of Agriculture.
Little, E L. 1951. Mapping ranges of the trees of the United States. Rhodora, 53: 195–203.
Little, E. L. 1971. Atlas of United States trees: Conifers and important hardwoods (Vol. 1). Washington, DC: United States Department of Agriculture Forest Service.
Little, E. L. 1976. Atlas of United States trees: Minor western hardwoods (Vol. 3). Washington, DC: United States Department of Agriculture Forest Service.
Little, E. L. 1977. Atlas of United States trees: Minor eastern hardwoods (Vol. 4). Washington, DC: United States Department of Agriculture Forest Service.
Little, E. L. 1978. Atlas of United States trees: Florida (Vol. 5). Washington, DC: United States Department of Agriculture Forest Service.
Little, E. L. 1981. Atlas of United States trees: Supplement (Vol. 6). Washington, DC: United States Department of Agriculture Forest Service.
Munns, E. N. 1938. The distribution of important forest trees of the United States. Washington, DC: United States Department of Agriculture Forest Service.
De Rigo, D., Caudullo, G., Houston Durrant, T., and San-Miguel-Ayanz, J. 2016. The European atlas of forest tree Species: Modeling, data and information on forest tree species. In: San-Miguel-Ayanz, J., De Rigo, D., Caudullo, G., Houston Durrant, T., and Mauri, A. (Eds.), European atlas of forest tree species. Luxembourg: Publishing Office of the European Union.
Sargent, C. S. 1884. Report on the forests of North America (exclusive of Mexico). Washington, DC: Department of the Interior Census Office.
Sudworth, G. B. 1898. Check list of the forest trees of the United States: Their names and ranges. Bulletin of the United States Department of Agriculture, Division of Forestry, 17: 1–144.
Sudworth, G. B. 1913. Forest atlas: Geographic distribution of North American trees. Part 1: Pines. Washington, DC: United States Department of Agriculture Forest Service.
Sudworth, G. B. 1927. Check list of the forest trees of the United States: Their names and ranges. United States Department of Agriculture Miscellaneous Circular, 92: 1–297.
Citation: Ellenwood, J. 2019. Roaming through ranges: The evolution of tree species distribution maps in the United States. Arnoldia, 76(3): 14–27.
Viereck, L. A., and Little, E. L. 1975. Atlas of United States trees: Alaska (Vol. 2). Washington, DC: United States Department of Agriculture Forest Service.
Viereck, L. A., and Little, E. L. 2007. Alaska trees and shrubs (2nd ed.). Fairbanks, AK: University of Alaska Press.
James Ellenwood is the National Program Lead for Monitoring, Remote Sensing, and Geospatial Analysis Research at the United States Forest Service.