
“Permanence doesn’t really interest me. My whole focus has been on the activity of my life. Out of the activity has come a mass of works, which are really just evidence that I’m still paying attention.”
Robert Rauschenberg
Barrier islands are young landscapes. Although absolute dates are hard to pin down, the barrier islands that ring Florida’s coast are only about five thousand years old and represent some of the most dynamic landscapes in the world. In the context of earthly timescales, the islands surfaced at the end of the Stone Age, around the same time that written language was developed in Ancient China and humans began to interact with yeast microorganisms for producing alcohol and bread. At the time, plant life was already well established for millions of years, taking root firmly and resolutely across landscapes that were only slightly more intact than not.
Today, Florida’s coastline extends 1,350 miles, of which 700 miles are structured by barrier islands that are characterized by urbanization rather than earthly formation. Development is intended to prevent the young landscape from further formation, arresting worth in property value while securing costly infrastructure projects. Young soils are paved and only tend to host disturbance-adapted plants that creep in along built lines, chain-link fences, beachfront terraces, and in the obvious cracks between sidewalks. The most iconic plants are the mangrove species (Rhizophora mangle, Laguncularia racemosa, Avicennia germinans) that silhouette the shoreline, while florific beach sunflowers (Helianthus debilis), green-fruited pond apples (Annona glabra), and sea grapes (Coccoloba uvifera) with dense crowns are commonly found inland. In this setting, few remnants of the barrier island ecology remain amidst the rich imported flora of the mixed tropical and temperate zones.
If you consult a map of Florida on your handheld device, the string of thin barrier islands that contour the coast is barely legible. Zooming in yields more clarity between land and water. Each barrier island floats along the shore of the mainland, stitched together by a line of causeways and interstate roads that seem to pull the islands landward, or stop them from moving seaward. Now, zoom in on the west coast near Fort Myers. Here, the stitch is called the Sanibel Causeway, which starts at a small crossing known as Punta Rassa. The causeway is supported by a sandy spit that separates Pine Island Sound from the Gulf of Mexico. The route extends into Periwinkle Way and stretches the length of Sanibel until it turns into the next stitch line at Blind Pass, a managed inlet known for shelling and fishing. Blind Pass is the last stop before arriving on Captiva Island.
Consider the same map, and zoom in again on Captiva Island: the gray asphalt of parking lots and sidewalks, the vectorized streets and alleys, and the blank fills of the private space around each foundation. If you search for directions, the route leads you past green golf courses and beige beaches, while the rest of the landscape is defined by different shades of gray. There is no public information beyond the built form, and certainly no recognition of plant life.
The lack of public knowledge about plants always strikes me as unusual, although it comes up frequently in my work as a practicing landscape architect and as a professor and researcher, studying the interactions between human and plant life. Within landscape architecture, the prominence of pathways and built structures seems to resonate with the public more than careful attention to particular plants. Presumably, this is one reason why landscape architecture is losing plant knowledge.1 So when it comes to finding your way in a new landscape, it is no wonder that the only means of tracking distance and not getting lost are found in the gray surfaces that demarcate outward appearance and built materials. But, as streets are inundated, seawalls fail, and foundations erode, might the endurance of plant life be appreciated in new ways?
Designing a Plant Inventory
In 2017, I was commissioned to study the changing conditions at the home of Robert Rauschenberg on Captiva Island, in order to propose a landscape-based adaptation plan to the effects of a changing climate.2 These effects include, but are not limited to, sea-level rise. Across Florida, the effects cascade: warmer waters increase the velocity of hurricanes, increased salination threatens drinking water supplies, the blooms of red tide devastate sea life, while blue-green algae amalgamate with heavy erosion to suppress tourism. The risks brought on by our warmer climate are not singular, which is why there is no simple solution.
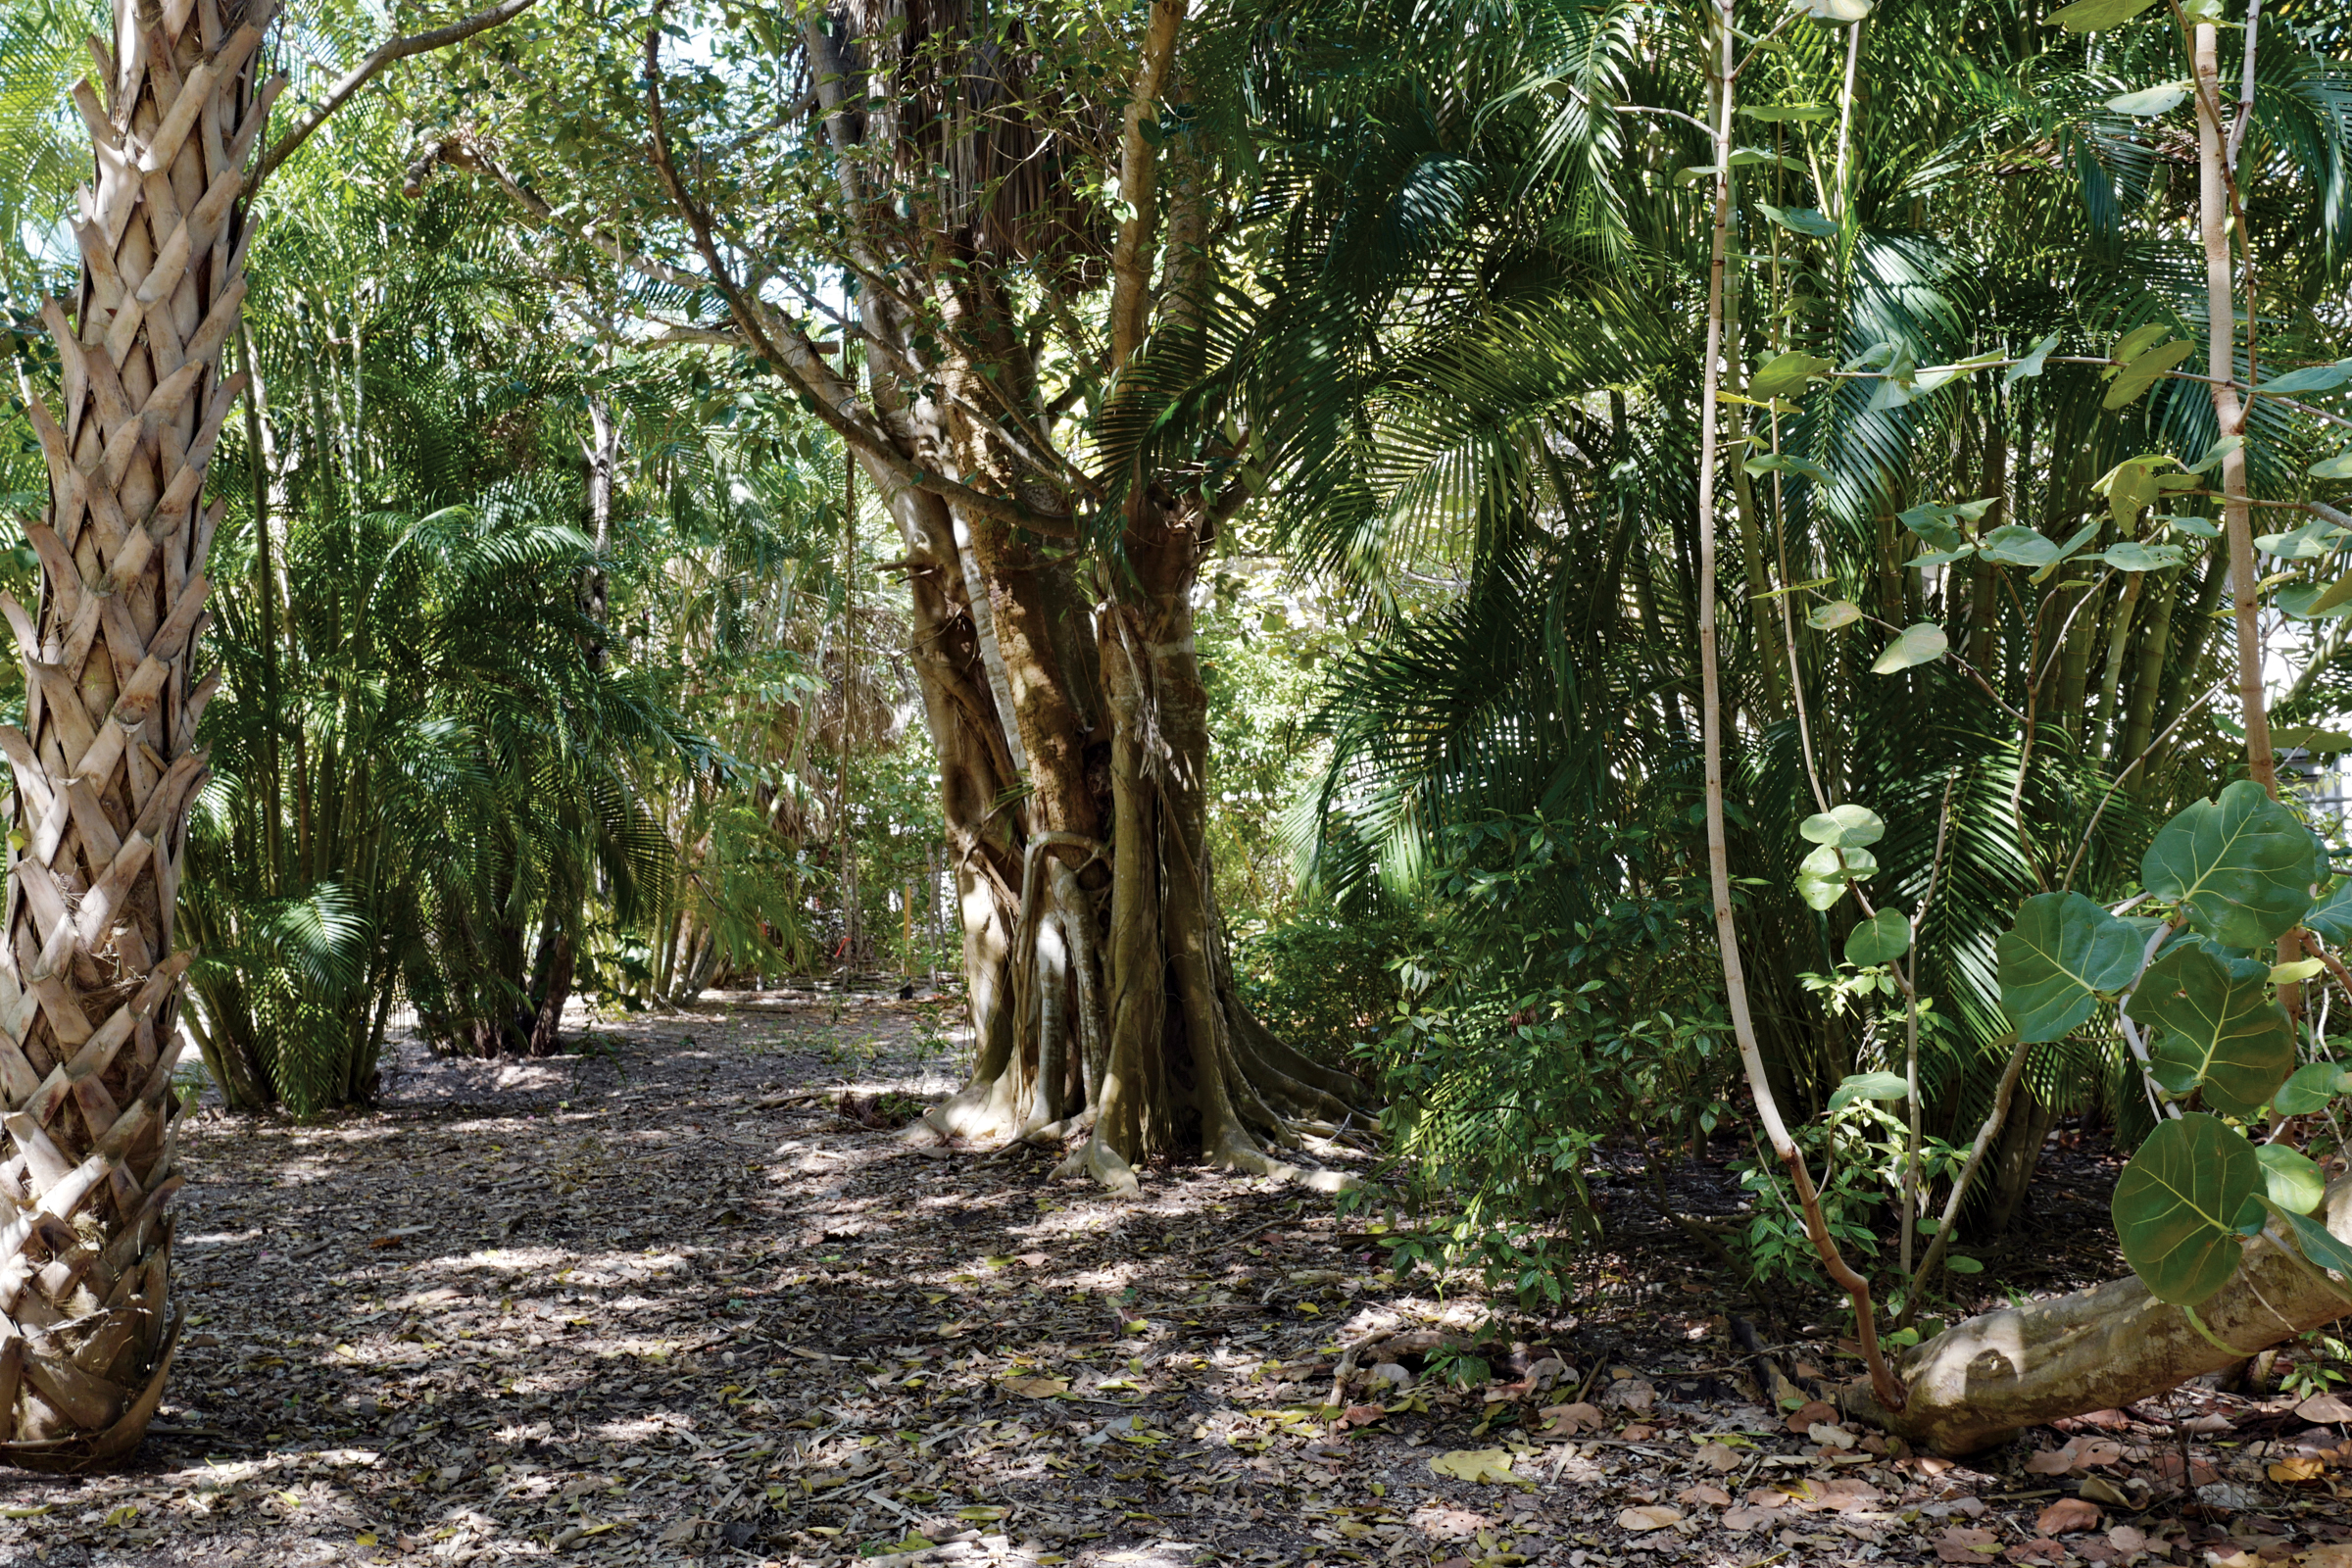
Rauschenberg cared deeply for Captiva both in terms of creative inspiration and also because it appealed to his ideas of impermanence, so elegantly stated in an interview about his art process: “Permanence doesn’t really interest me.” When we were guided through our first site visit, intricacies of the built landscape were prioritized, including workshops for printmaking and dance studios, a beach house, the main studio, and the historic Fish House—a building perched in the bay.3 Yet, the grounds are most remarkable because they encompass twenty acres of uninterrupted barrier island, a landscape that bridges the bay and the beach sides. Most properties either enjoy views of the beach or the bay, but rarely both. The Rauschenberg campus is verdant and alive with a continuous canopy that distinguishes it from the rest of the island because Rauschenberg valued the dynamic landscape and never sought to arrest and define it. The grounds—now used to host an internationally recognized artist residency program—are so culturally rich and ecologically lively that there was no lack of inspiration, and I was eager to get started.
At its widest, Captiva is two thousand feet wide; at its narrowest, only about four hundred feet. The Rauschenberg campus sits along the widest portion. Despite its verdant ecology, a standard map registers gray tones, presumably because private land is not rendered beyond building footprints. As the project began, I sought more detail from standard site plans and surveys, the basis of architectural traditions, anticipating more specificity because Rauschenberg himself was so committed to his plants. In particular, he was committed to maintaining an area that he called the jungle, a ramble of sprouting spontaneous plants that makes up almost half the site.4 Rather, we were handed a site plan that outlined the property lines and included the building footprints, connected by a path system. The rest of the site was white. A site plan without any indication of plants is not only blank; it creates the impression of a landscape devoid of life. As a result, our first act of design was to put the plants back on the map.
Creating a plant inventory for a landscape architectural project is not a normative or established convention. But a plant inventory is a curatorial tradition that supports research within the living collections of arboreta and botanic gardens. An inventory charts long-term change and unlocks the puzzles of horticulture, so it is surprising that inventories are not more of a standard in professional practice.The objective of a plant inventory is to document and describe the current status of a collection. Over time, the inventory can be compared to past iterations, revealing landscape changes.5 In turn, this secures a plan for future plantings. A plant inventory must be updated in order to remain dynamic, which requires ongoing interaction in the field. This is especially true because plants move, die back, transform, and sometimes shift from their original locations.
Typically, an inventory is established at the same time as a garden and creates a baseline to determine future accessions and deaccessions. For instance, the first accession records at the Arnold Arboretum date to 1872, the year the institution was founded, although it took about a decade for the initial card-file system to be refined. In an account from 1881, Charles Sprague Sargent outlines the importance of the inventory but admits that accurate records are often abandoned because they are “too expensive for practical working.”6 He references the future value of recording each plant despite the challenge, suggesting that the effort must bear the test of time. At the Rauschenberg campus, our team believed that the strain of changing climates made the connection to time even more powerful. Establishing a curatorial tradition within an undocumented collection posed two important challenges to the inventory from the start: first, to establish what constituted a “tree” among a host of woody plants, and second, to assess a largely spontaneous collection. Both challenges forced us to make value judgments based on what to count, and thus what to omit, a puzzle that raised more questions than we could answer alone.
The Inventory Process
The Sanibel-Captiva Conservation Foundation (SCCF) was founded in 1974 by a group of Islanders committed to the preservation of the island ecosystem. At the time, SCCF successfully opposed development in Sanibel by incorporating as a city, enabling votes on dredge-and-fill policy, uprooted mangroves, seawall construction, and overscaled condominiums.7 The same constituency hired the firm of Ian McHarg, the renowned landscape architect who wrote Design with Nature, an influential ecological treatise.8 Captiva did not follow suit and has experienced the consequences of haphazard planning ever since. This is one of the main reasons that the Rauschenberg campus is so uniquely important: it is an anomaly in the landscape that might help inform Captiva’s future.
Our team, based in Massachusetts, worked with local horticulturist Jenny Evans from SCCF to initiate the process of developing a baseline for the plant inventory. Without a baseline, neither preservation nor conservation exists. It creates a reference for measuring and assessing disturbance. Although Jenny and her team had little experience establishing a plant inventory, she saw value in the challenge due to the extremities of change expressed by plant loss throughout the hurricane season. The baseline would help us chart the rapidity of change in both the loss of material in hurricane season and, hopefully, the regrowth of disturbance-adapted species. Collectively, we were motivated to tackle the questions raised about the process of gathering and digitizing the data because we saw the importance of creating publicly accessible plant knowledge.
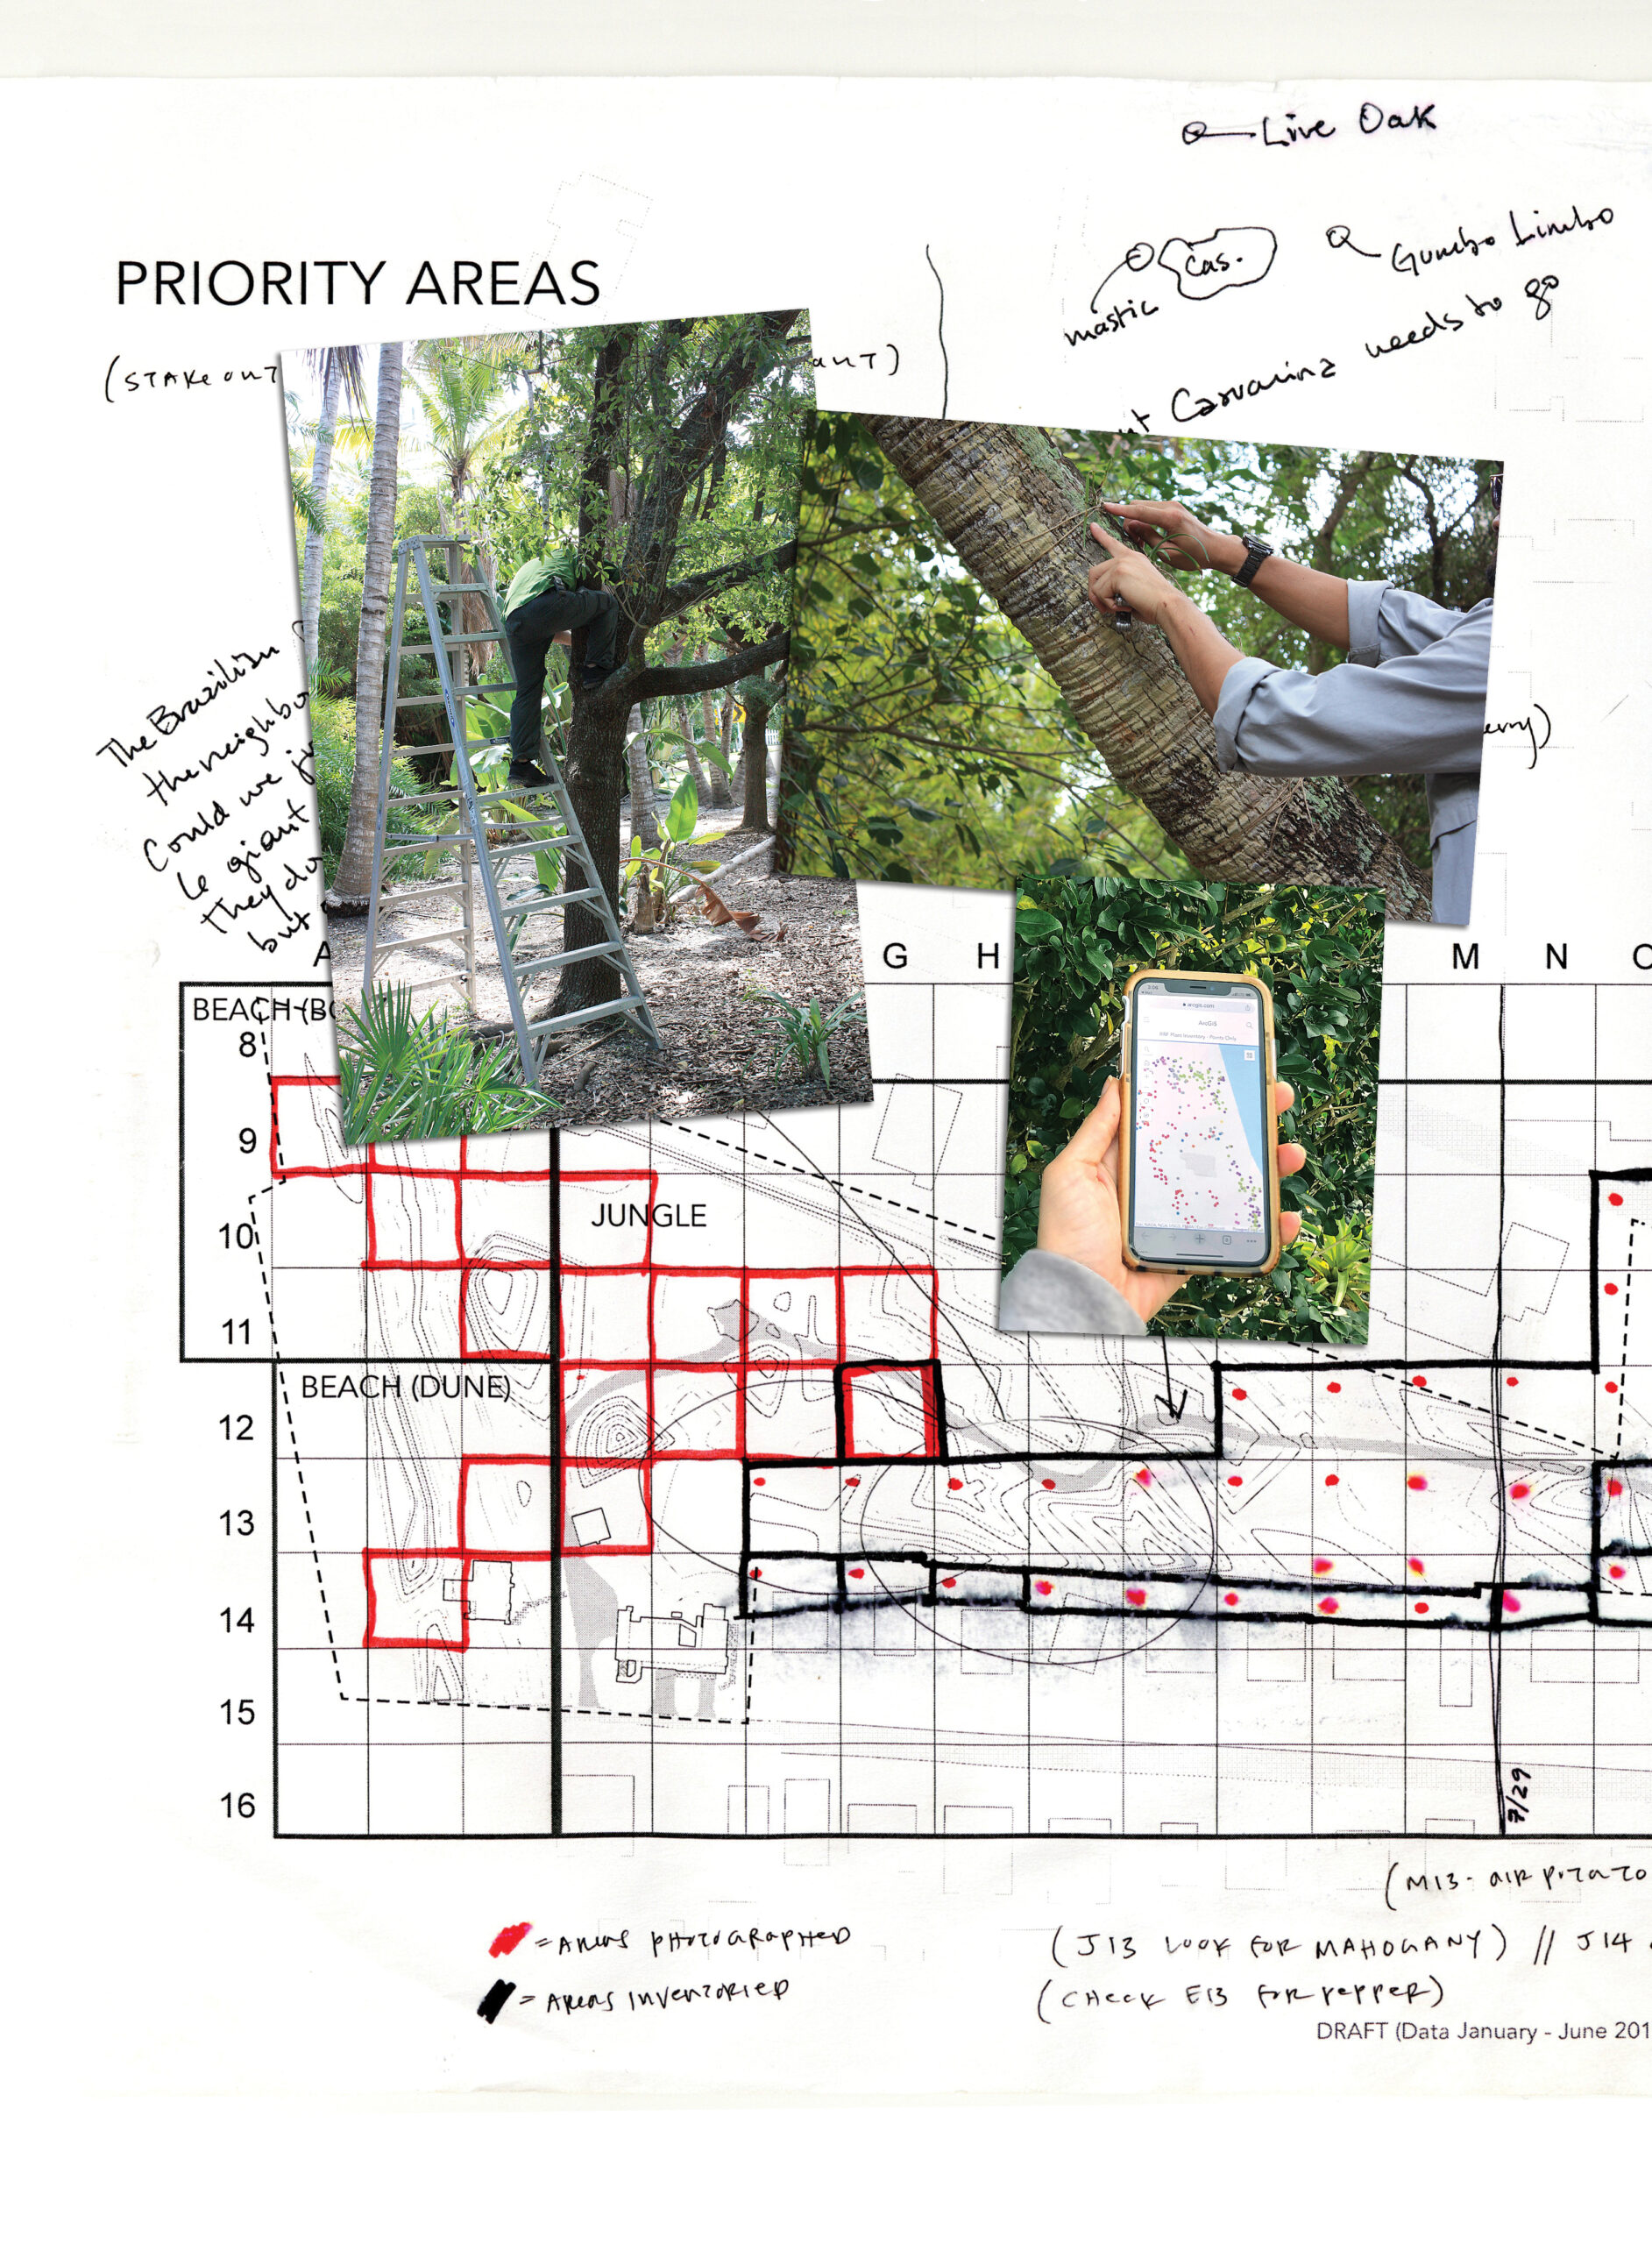
Our inventory would prioritize woody plants, but as we worked through our initial questions, we found that trying to define a “tree” at Captiva proved conceptually hazardous in itself.9 Many woody plants do not behave as trees with a single trunk, but clump or spread. To capture this distinction, we created two categories of data: rather than discriminating between trees and shrubs, we suggested points and areas. Points recorded the center of woody plants with single trunks. Areas recorded the total diameter of the woody plant—the perimeter of all trunks and shoots. Each point was recorded in a discrete location using latitude and longitude, while areas were recorded by walking the perimeter of the plant and recording the path.10 The system of areas was especially useful for taking stock of the mangrove fringe on the bay side, yet flexible enough to allow us to indicate where specific points were noticeable as major trunks within the tangle. The points within the mangrove area are only one example of how the standards of defining a tree helped us standardize a method across a site full of exceptions.
As trees were defined and included in the inventory, a workflow developed between the on-site project team and the data input team. First, the site was divided into 75-by-75-foot quadrants in order to work systematically across the landscape. The quadrants did not have to be delineated in physical space: they were charted by datasets of a handheld GPS device. The on-site team then recorded woody plants using the system of points and areas, and the data from each quadrant was shared with our team sitting at our studio in Massachusetts. This workflow enabled the field team to move from one quadrant to the next and continue to amass data.11 Our team uploaded their new field data to a global information system (GIS) and aligned this work with site surveys used in the original design documents.12 We checked the data, cleaned duplicates or errors, and assigned a unique catalog code in GIS, which was exported with labels and integrated into the site survey.
The process raised questions about what type of data was most useful to contain on the map label and how the information could be read by those both familiar with and unfamiliar with plants. Therefore, we decided on two distinct categories: standard and custom. Standard data included common, Latin, and family names, along with trunk diameter (at breast height) in centimeters, height taken in meters, geospatial location (latitude, longitude), location on site (quadrant), and the year recorded. To include canopy cover in the standard category, Jenny came up with a novel expression—a range from one to five—that corresponded to how much of the sky could be seen when standing at the trunk. If 80 to 100 percent of the sky was obscured, she would give the canopy a five; 60 to 80 percent obscured would be a four, and so on. This might not seem relevant in the context of temperate trees, but in a tropical site that is largely overgrown by densely sprouting palms, the canopy can still lack density, which affects overall shade and comfort despite height and maturity. We also assigned a Florida Exotic Pest Plant Council category to each plant. Finally, we created a unique identifying code for each woody plant in the inventory.
The custom category necessitated the most creative collaboration as we imagined what future residents and stewards might wish to know about the plants of the present. The first section within the custom category includes descriptions of environmental influences (damaged or broken limbs, leaning habit, and so forth), notes about neighboring plants in relation to the spread (consider for instance Ficus aurea, the strangler fig, which envelops a host tree), and surveyor comments. The collaboration with SCCF was crucial to the comments section and includes remarks about character or significance that were personal, such as “never seen it grow this way” or “covered in lianas,” a crucial input to research in heavily urbanized landscapes that resist standards. The subsection also provides space for more nuanced assessments of the Florida Exotic Pest Plant Council criteria, with notes such as “typically invasive, but not aggressive on this property” that overcome the binaries of what typically counts and what doesn’t count in a living collection.
In the Context of Change
Landscape design often implies stability and predictability. Yet, the dynamics of the landscape are changing, which invites practices to change in turn. This need is especially pronounced on the Florida coast. As we looked for models for our project, we consulted with curatorial staff at public gardens and found a range of concerns. At the Arnold Arboretum, for instance, staff pay especially close attention to evidence of infestations, as some of the most devastating losses to the living collection are brought on by foreign pathogens.13 While the rise of foreign pathogens is certainly not bound to the Northeast, Florida must first contend with the intensely localized effects of increased storm damage brought on by rising seas.
A more apt comparison might be made to the inventory at Montgomery Botanical Center in Coral Gables, Florida, a historic collection specialized in the conservation of palms, cycads, and conifers from across the world. The garden is a coastal site vulnerable to episodes of increased storms and the very real effects of about one-third of an inch (nine millimeters) of rise in sea level per year.14 Thus, Montgomery is grappling with a concern common to all coastal living collections in a time of rapid climate change: How far into the future should we plan? While this is an enduring question in relation to living collections, it finds amplified resonance considering that Montgomery calculates an increased inundation of forty-three acres, or 36 percent of the entire garden.15 While this number is staggering, the plant inventory confirms that only 8 percent of the collection will be lost in this scenario. Although the figure does not include storm damage, salt intrusion, and other vulnerabilities, it does significantly change the answer to the question: planning can no longer occur in one-hundred-year increments.
The status of any living collection is dependent on maintaining an inventory, which raises questions as to why plant inventories are not more commonly practiced beyond the world of public gardens. In the context of barrier islands, like Captiva, change is noticeable seasonally as hurricanes sweep across the surface of the land while fluctuating sea levels remake the coastline. But, of course, landscapes everywhere are increasingly in states of flux. The knowledge of how to create and maintain an inventory is critical to engendering a unique collaboration between plant and human life within our everyday landscapes. A plant inventory is a record of human and biotic adaptation, a neutral middle ground that accumulates experience and data. It helps visually connect the public to the effects of accelerated climate change, and in a practical sense, it inspires care and helps humans take notice of the plants in their environment.
After the success of developing the plant inventory at the Rauschenberg campus, our team’s ensuing idea is to adapt the same open-source technology into a handheld, user-friendly platform that could form the basis of a public inventory for landscapes anywhere, populating our blank site plans and challenging generic street views. We imagine citizen scientists learning to create a site history, as plants under their stewardship become a baseline for future generations. Plant inventories are crucial to increasing an awareness of change, especially in the face of both chronic and episodic stresses of the twenty-first century. Perhaps we can shape an understanding of change by visualizing and valuing impermanence.
Endnotes
1 A number of authors, myself included, write about the loss of plant knowledge in design. See, for instance: Raxworthy, J. and Harrisson, F. 2018. Overgrown. Cambridge: MIT Press.
2 Practice Landscape includes Emily Hicks and Joanna Lombard, and we were commissioned by the Robert Rauschenberg Foundation to work as part of a team in collaboration with WXY architects and eDD engineers.
3 Rauschenberg bought the Fish House from Jay Norwood “Ding” Darling, chief of the US Fish and Wildlife Service (formerly the Biological Survey). Ding Darling is best known for ushering in the Federal Duck Stamp Program to expand the federal purchase of wildlife habitat. See, for instance: Ding Darling Wildlife Society. n.d. Our namesake. https://dingdarlingsociety.org/articles/our-namesake
4 The cultural history of the plantings is culled from various oral accounts and conversations, especially with Matt Hall, the site manager who worked closely with Rauschenberg on Captiva, until Rauschenberg’s passing in 2008.
5 The Arnold Arboretum plant inventory claims that to meet objectives “the Arboretum fields expert curatorial staff able to conduct inventories as well as troubleshoot an array of taxonomic, cartographic, and horticultural puzzles.” See: Arnold Arboretum of Harvard University. 2011. Plant inventory operations manual (2nd ed.). http://arboretum.harvard.edu/wp-content/uploads/2020/07/plant_inventory_operations_manual.pdf
6 Sargent, C. S. 1882. In Harvard University, Annual reports of the president and treasurer of Harvard College, 1881–82 (pp. 122–123). Cambridge, MA: University Press.
7 SCCF’s mandate continues to advocate through education and outreach, supported by an intellectual generosity and a spirit of collaboration. For a short history of SCCF in the context of early development see: Davis, J. E. 2017. The Gulf: The making of an American sea (pp. 406–410). New York: Liveright Publishing Corporation.
8 McHarg, I. L. 1969. Design with nature. Garden City, NY: Published for the American Museum of Natural History [by] the Natural History Press.
9 We initially turned to a definition of trees provided by the Arnold Arboretum’s Peter Del Tredici: “A tree can be defined as a plant that, when undisturbed, develops a single, erect woody trunk. A shrub, on the other hand, is a woody plant that, when undisturbed, branches spontaneously at or below ground level to produce multiple stems. In general, a tree will develop secondary trunks in response to injury to its primary trunk or root system, to displacement of its primary stem out of the normal vertical orientation, or to a dramatic change in surrounding environmental conditions.” Despite the usefulness of this definition, in practice, we found the distinction was difficult to apply at Captiva. Del Tredici, P. 2001. Sprouting in temperate trees: A morphological and ecological review. The Botanical View 67: 121–140.
10 Data was collected using a handheld Trimble, a GNSS-based data collector that is integrated with ArcMap GIS and is the standard in forestry surveys. This system allows for ease of data entry and storage that works well with our needs for both quantitative and qualitative data. Model: Trimble Geo 7X.
11 The field team received the initial GIS data for each quadrant as a CSV and shapefile.
12 This data alignment involves changing the coordinate system to a projected coordinate system.
13 Emerald ash borer (Agrilus planipennis) and hemlock wooly adelgid (Adelges tsugae) are of particular concern in eastern Massachusetts. Among numerous scientific studies on monitoring, see, for instance: Knight, K. S., Flash, B. P., Kappler, R. H., Throckmorton, J. A., Grafton, B., and Flower, C. E. 2014. Monitoring ash (Fraxinus spp.) decline and emerald ash borer (Agrilus planipennis) symptoms in infested areas. General Technical Report NRS-139. Newtown Square, PA: United States Department of Agriculture, Forest Service, Northern Research Station.
14 Wdowinski, S., Bray, R., Kirtman, B. P., and Wu, Z. 2016. Increasing flooding hazard in coastal communities due to rising sea level: Case study of Miami Beach, Florida. Ocean & Coastal Management, 126: 1–8.
15 According to a one-hundred-year projection: Griffith, M. P., Barber, G., Tucker Lima, J., Barros, M., Calonje, C., Noblick, L. R., Calonje, M., Magellan, T., Dosmann, M., Thibault, T., and Gerlowski, N. Plant collection “half-life:” Can botanic gardens weather the climate? Curator: The Museum Journal, 60(4): 395–410.
Rosetta S. Elkin is an associate professor at McGill University, an associate of the Arnold Arboretum at Harvard University, and the founder and principal of Practice Landscape. Rosetta’s work considers living environments with a particular focus on plant life and climate change. She teaches planting design, fieldwork, and seminars that advance a theory of plant life between ecology and horticulture.
Citation: Elkin, R. S. 2021. An impermanent inventory: Plant collections for a changing climate. Arnoldia, 78(4): 16–23.